Download
1 / 1
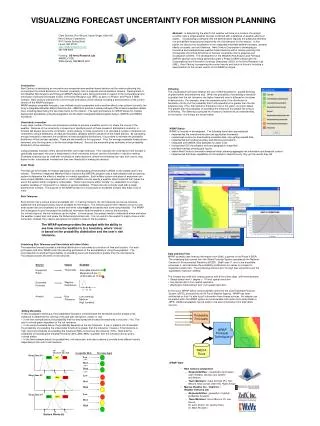
10 likes | 139 Vues
The Weather Risk Analysis and Portrayal (WRAP) decision aid by Next Century Corporation revolutionizes mission planning by integrating ensemble weather forecasts and risk tolerance assessments. This innovative tool addresses forecast uncertainty, providing military planners with enhanced visualization of weather-related risks. Supported by the Army Research Lab, WRAP utilizes a user-friendly interface to analyze varied thresholds, enabling informed decision-making. During this presentation, we will demonstrate WRAP's features, showcasing its current prototype and its potential impact on mission success.

E N D
Values Example Source Thresholds Equipment Rules Favorable below 9 kts; Marginal at 9 kts; Unfavorable at 13 kts Probability Forecasts Weather Distribution Ensemble Forecast WRAP Portrayal Techniques Forecast Data Clark Dorman, Ron Wilcom, Hyam Singer, Allen Hill Next Century Corporation 8101 Sandy Spring Road Laurel, MD 20707 allen.hill@nextcentury.com 301-939-2600 Funding: US Army Research Lab AMSRL-CI-EB White Sands, NM 88002-5501 5 10 15 5 10 15 5 10 15 Analyst Risk Tolerance Low (training) Medium High (combat) IWEDA Rules 5 10 15 9kt Threshold 13kt Threshold Acceptable Risk Decision Input Drop Zone #1 Low Med High Low Med High Low Med High 99% 1% 0% (10%) (40%) (70%) Drop Zone #2 2% 40% 58% • Next Century Corporation • Responsibilities: visualization techniques,user interface, decision aid, system architecture • Team Members: Clark Dorman (PI), Ron Wilcom, Neal Loman, Allen Hill, Hyam Singer • Marcus Weather Inc. / ZedX Inc. /Weather Ventures Ltd. • Responsibilities: generation of globalprobability forecasts • Team Members: Kevin Marcus, Dr. Joe Russo,Dr. John Dutton, Dr. Jeremy Ross,Dr. Mark Roulston Drop Zone #3 37% 52% 11% Surface Winds (kt) VISUALIZING FORECAST UNCERTAINTY FOR MISSION PLANNING Abstract: In determining the effects that weather will have on a mission, the analyst currently uses a single weather forecast combined with a database of weather effects on assets. Incorporating uncertainty into the determination requires the additional elements of a probabilistic forecast and, importantly, the risk tolerance for the mission. In this poster, we discuss the visualization of the integrated ensemble weather forecasts, weather effects on assets, and risk tolerance. Next Century Corporation is developing an innovative and comprehensive weather-based decision aid for mission planning that incorporates this critical dimension of forecast uncertainty into its analyses and visualization scheme. The development of the Weather Risk Analysis and Portrayal (WRAP) decision aid is being performed under a Phase II SBIR contract with the Computational and Information Sciences Directorate (CISD) of the Army Research Lab (ARL). Next Century is presenting the current results and status of this aid, including a demonstration of the current version of the WRAP prototype. Introduction Next Century is developing an innovative and comprehensive weather-based decision aid for mission planning that incorporates the critical dimension of forecast uncertainty into its analyses and visualization scheme. Development of this Weather Risk Analysis and Portrayal (WRAP) decision aid is being performed in support of the Computational and Information Sciences Directorate (CISD) of the Army Research Lab (ARL) as part of a Phase I and Phase II SBIR contract. Next Century presents the current results and status of this initiative including a demonstration of the current version of the WRAP prototype. WRAP employs ensemble forecasts, user-defined mission parameters and a weather effects rules system (currently, the Army’s Integrated Weather Effects Decision Aid—IWEDA) to produce a visual portrayal of the mission’s weather-related risks, including determining the best time frame for the mission. The open architecture for WRAP allows for multiple deployment possibilities, including integration into the DoD’s Integrated Meteorological System (IMETS) and IWEDA framework. Uncertainty in weather A very large number of forces and processes combine to produce a weather event or to shape the course of the weather. Because of the uncertainty in observing or specifying each of these causes of atmospheric evolution, a forecast will always have some uncertainty. A key strategy in using uncertainty is to calculate a number of forecasts (an ‘ensemble’) using a distribution of initial and boundary variables and the variations of the model physics. By calculating enough forecasts to represent the conditions in these probability distributions, it is possible to estimate the probability distribution of the forecast variables. There are two benefits to this approach. First, the average ensemble forecasts are observed, over the long term, to be the best single forecast. Second, the ensemble gives estimates of the probability distribution of the outcomes. Using probability forecasts offers several benefits over single forecasts. First, because the uncertainty in the forecast is specifically expressed, the user is made aware of that uncertainty and can use that information in decision making. Ensemble forecasts can be used with thresholds to make decisions, where the thresholds can vary from user to user, based on the uncertainties involved and their own threshold for making the decision. Asset Rules The final use of forecasts for mission planning is an understanding of the weather’s effects on the assets used in the mission. The Army’s Integrated Weather Effects Decision Aid (IWEDA) program uses a sophisticated rules processing system to determine the effects of weather on combat operations. Each military system and piece of equipment can have multiple IWEDA rules associated with it. Each IWEDA rule can specify a weather effect threshold that makes the use of the system either marginal or unfavorable. These rules may be either “simple” (i.e. dependent on a single weather variable) or “compound” (i.e. based on several variables). These rules are currently used with a single deterministic forecast. The purpose of the WRAP project is to incorporate an ensemble forecast with these sorts of rules. Risk Tolerance Each mission has a unique level of acceptable risk. In training missions, the risk tolerance can be low, because additional time and opportunities may be available for the mission. The mission planner then needs to know not only when asset rules are exceeded, but where and when rules might be exceeded with some low probability. The WRAP tool is designed to give the analyst this additional information and the weather is close to the boundary. For critical missions, the risk tolerance can be higher. In those cases, the analyst needs to understand where and when the weather is least bad, and where the limited opportunities exist. It is not useful to the analyst to simply show a solid red screen; instead, they need to see where the system is close to the boundaries. Dithering This visualization technique employs the use of dithered patterns: graded dithering of green/amber and amber/red dots. When the probability of exceeding a threshold is greater than the risk tolerance, the higher threshold color is dithered on the lower threshold color. For example, when the expected value of the distribution is favorable (<9 kts), but the probability that it will exceed 9 kts is greater than the risk tolerance (say, 10%), then amber is dithered on top of the green, as shown below. The greater that the probability of exceeding the threshold, the greater the amount of dithering. The dithering is grouped into 9 steps to improve visual understanding of the results; the 9 steps are shown below. • WRAP Status • WRAP is currently in development. The following have been accomplished: • implemented the overall architecture and application framework. • created web service for downloading ensemble data, only getting needed data • implemented both sliding boundary and dithering calculations • integrated with IWEDA rules database for asset rules • incorporated GIS visualization tools and geographic shape files • provided overlays showing grid results • added Next Century’s innovative temporal slider, showing aggregate risk information and temporal context • implemented drill-down capabilities for the analyst to determine why they got the results they did The WRAP system provides the analyst with the ability to see how close the weather is to a boundary, where ‘close’ is based on the probability distribution and the user’s risk tolerance. Combining Risk Tolerance and Uncertainty with Asset Rules The ensemble forecast provides a statistical distribution of outcomes as a function of time and location. For each grid square and time, WRAP colors the resulting grid based on the acceptability of using the equipment. The color depends on whether the probability of exceeding asset rule thresholds is greater than the risk tolerance. The analyst provides the level of risk tolerance. • Data and Data Flow • WRAP currently uses forecast information from ZedX, a partner in the Phase II SBIR. The underlying data comes from the Global Forecast System operated by the National Centers for Environmental Prediction (NCEP). ZedX uses 11 runs in the ensemble, processes it, and calculates the probability distributions for values to compare to equipment asset rules. The processing reduces error through bias corrections and the expectation maximum method. • The forecast has a 48-hour forecast period, with 6-hour time steps, with three domains: • Global domain with 1 degree (~ 110 km) spatial resolution • Iraq domain with 10 km spatial resolution • Washington State domain with 1 km spatial resolution • In the future, WRAP will be using ensemble data from the Joint Ensemble Forecast System (JEFS), produced by the Air Force Weather Agency. WRAP has been architected so that it is able to pull information from diverse sources. An adapter can be placed within the WRAP system to pull ensemble information from either ZedX or JEFS. Additional adapters can be used to use asset information from alternative sources. • Sliding Boundary • In this visualization technique, the probabilistic forecast is combined with the thresholds and the analyst’s risk tolerance to determine the coloring of the grid with solid green, amber, or red: • In the first example below, the probability that the wind speed will exceed the thresholds is very low (~1%). The grid is colored green regardless of the risk tolerance. • In the second example below, the probability depends on the risk tolerance. If low or medium risk is tolerated, the probability of exceeding the unfavorable threshold is greater than the tolerance; however, if the tolerance is high, then the probability of exceeding the threshold (58%) is less than the tolerance (70%). Note that the probability of exceeding the marginal threshold (40%+58%=98%) is greater than the tolerance and so grid is colored amber. • In the third example below, the probabilities, risk tolerances, and rules combine to provide three different results depending on the user’s risk tolerance. WRAP Team