Download
1 / 33
330 likes | 476 Vues
Visualizing Uncertainty in Mesoscale Meteorology. APL Verification Methodology 21 May 2002 Scott Sandgathe. A New Paradigm for Weather. Forecasting. Automated Meteorological. Human. Information. Decision Driven. Forecaster. Evaluation System. Auto-Product. Decision. Generation.

E N D
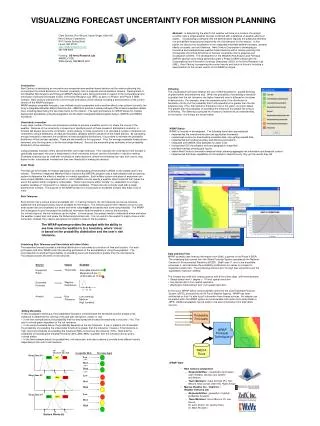
Visualizing UncertaintyinMesoscale Meteorology APL Verification Methodology 21 May 2002 Scott Sandgathe
A New Paradigm for Weather Forecasting Automated Meteorological Human Information Decision Driven Forecaster Evaluation System Auto-Product Decision Generation Interface Decision Interface is comprised of: Verification of Rule-based Evaluation of Global and evaluation of Current Met. Meso Models model Analyses past forecasts predictions MURI/UW 2/13/02
Wt. MM5 evaluation MM5 evaluation Wt. MM5 evaluation Wt. Global and Regional RMSE Evaluation – Recent, Historical and Synoptic Evaluation of Ensemble members and combinations – recent, historical and synoptic Verification and Evaluation NOGAPS Output Eval. Ensemble Products ETA centroid Evaluate current analyses based on observations, satellite and radar Reform ensemble or chose “most-representative” member based on user evaluation Products are automatically generated based on user-selected ensemble or member.
00Z 06Z 12Z 18Z 00Z . .. OBS OBS OBS OBS OBS Analysis Analysis Analysis Analysis Analysis Forecast 72-120hr Forecast 6 hr Forecast 72-120 hr Forecast 6 hr Forecast 72-120 hr Global RMS Error
Regional RMS Error Global models are often “tuned” to the region of national interests or to the predominate natl weather pattern, and global skill may not reflect regional skill. The region between 110E and 110W accounts for the majority of 0 – 48h weather.
Mesoscale Verification O F O F O F O F All equivalent?! POD=0, FAR=1 (Brown, 2002)
Mesoscale Verification POD >> 0, FAR < 1 Is this a better forecast? O O F Or is this? O F (After Brown, 2002)
Mesoscale Verification • Total Error = Displacement Error + Amplitude Error + Residual Error • MSE and CCF give equivalent results • Hoffman, et. al., 1995, for satellite data assimilation. • MSE(tot) = MSE(disp) + MSE(amp) + MSE(pattern) • Elbert and McBride, 2000, for precipitation pattern verif. • Implementation (Du and Mullen, 2000): • Calculate MSE(tot) = (Forecast – Analysis)2 • Shift forecast field to minimize total MSE and calculate MSE(disp) = MSE(tot)-MSE(shift) • Adjust amplitude to minimize MSE(shift). MSE(amp) = MSE(shift) – MSE(shift-min) • MSE(residual) = MSE(tot) – MSE(disp) – MSE(amp) • MSE(res) =? MSE(pattern) =? MSE(rotation)
Future Research Issues • Need to test on “real” data. • Many computational solutions: • Correlation Coef., Mean absolute difference, etc. • Rapid ‘image motion’ search techniques • Map verification or “feature” verification: • Phase and amplitude suitable for both • Rotation requires “feature” and more complex search • Need to examine usefulness • Evaluation of “goodness” • Relative weight of phase vs amplitude vs rotational err • Will test “table” approach often seen in software or “service” evaluation.
References • Hoffman, R. N., Z. Liu, J.-F. Louis, and C. Grassotti, 1995: Distortion representation of forecast errors. Mon. Wea. Rev., 123, 2758-2770. • Brown, B., 2002: Development of an Object-based Diagnostic Approach for QPF Verification. USWRP Science Symposium, April 2002. • Ebert, E. E., and J. L. McBride, 2000: Verification of precipitation in weather systems: determination of systematic errors. J. Hydro., 239, 179-202. • Du, J., and S. L. Mullen, 2000: Removal of Distortion Error from an Ensemble Forecast. Mon. Wea. Rev., 128, 3347-3351. • Chan, E., 1993: Review of Block Matching Based Motion Estimation Algorithms for Video Compression. CCECE/CCGEI. • Lim, D.-K., and Y.-S. Ho, 1998: A Fast Block Matching Motion Estimation Algorithm based on Statistical Properties of Object Displacement. IEEE.
BACKUP SLIDES • SLIDES FROM 31 Jan 2002 Meeting
36km Ensemble Mean and Selected Members SLP, 1000-500mb Thickness 2002 Jan 2200Z
12km Ensemble Mean and Selected Members SLP, Temperature, Wind 2002 Jan 2200Z
Verification of Mesoscale Features in NWP Models Baldwin, Lakshmivarahan, and Klein 9th Conf. On Mesoscale Processes, 2001
Tracking of global ridge-trough patterns from Tribbia, Gilmour and Baumhaufner
Current global forecast and climate models produce ridge-trough transitions; however, the frequency of predicted occurrence is much less than the frequency of actual occurrence
Creating Concensus From Selected Ensemble Members - Carr and Elsberry
Necessary Actions for Improved Dynamical Track Prediction (48 h) Large Spread (806 n mi) Large Error Small Spread (229 n mi) Large Error No forecaster reasoning possible. Help needed from modelers and data sources to improve prediction accuracy Recognize erroneous guidance group or outlier, and formulate SCON that improves on NCON Large Spread (406 n mi) Small Error Small Spread (59 n mi) Small Error Recognize situation as having inherently low predictability; must detect error mechanisms in both outliers to avoid making SCON>>NCON No forecaster reasoning required -- use the non-selective consensus (NCON)
References Cannon, A. J., P.H. Whitfield, and E.R. Lord, 2002: Automated, supervised synoptic map-pattern classification using recursive partitioning trees. AMS Symposium on Observations, Data Assimilation, and Probabilistic Prediction, pJ103-J109. Carr. L.E. III, R.L. Elsberry, and M.A. Boothe, 1997: Condensed and updated version of the systematic approach meteorological knowledge base – Western North Pacific. NPS-MR-98-002, pp169. Ebert, E.E., 2001: Ability of a poor man’s ensemble to predict the probability and distribution of precipitation. Mon. Wea. Rev., 129, 2461-2480. Gilmour, I., L.A. Smith, R. Buizza, 2001: Is 24 hours a long time in synoptic weather forecasting. J. Atmos. Sci., 58, -. Grumm, R. and R. Hart, 2002: Effective use of regional ensemble data. AMS Symposium on Observations, Data Assimilation, and Probabilistic Prediction, pJ155-J159. Marzban, C., 1998: Scalar measures of performance in rare-event situations. Wea. and Forecasting, 13, 753-763.
Wt. MM5 evaluation MM5 evaluation Wt. MM5 evaluation Wt. NOGAPS Output Eval. Ensemble Products ETA centroid J2EE Control/ Interface Bean J2EE Control/ Interface Bean J2EE Control/ Interface Bean J2EE Control/ Interface Bean Java Server Pages for each Bean interface Control and Server-side components Server Protocols (HTTP, RMI, CORBA..) IMS & Viz. Tools (XIS) Stat. tools Meteorology tools