Accuracy and Error
Accuracy and Error. Accuracy - a measure of how close your measurement is to the accepted value . How close are you to the Bulls Eye!!! It does not matter if you are above or below. Bean Bag Champions Toss. Be in groups of 4 Follow the lab sheet instructions

Accuracy and Error
E N D
Presentation Transcript
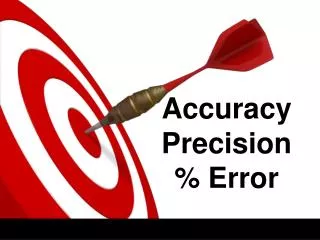
Accuracy and Error • Accuracy - a measure of how close your measurement is to the accepted value. • How close are you to the Bulls Eye!!! • It does not matter if you are above or below.
Bean Bag Champions Toss • Be in groups of 4 • Follow the lab sheet instructions • Only DO part 1, we will work with the data tomorrow
Accuracy and Error • Error - the difference between your measurement and the accepted value.
Accuracy and Error • Absolute Error (Ea) - the absolute difference between your measured value and the accepted value.
Accuracy and Error Ea = |O – A| • Where • Ea is the Absolute Error • O is the Observed (Measured) Value • A is the Accepted Value
Bean Bag Toss Champions • Using the formula for Absolute Error, calculate from the your data collected
Accuracy and Error • Relative Error (Er) - the size of the absolute error as a percentage of the accepted value.
Accuracy and Error Er = (Ea/A) x 100 • Where: • Er is the Relative Error • Ea is the Absolute Error • A is the Accepted Value
Precision and Deviation • Precision - the agreement between a single measurement and the average of all of the measurements made the same way.
Precision and Deviation • REMEMBER: A precise measurement may not be an accurate measurement.
Precision and Deviation • Deviation is the difference between the one measurement and the mean (average) of all of the measurements.
Precision and Deviation Da = |O – M| Where: - Da is the Absolute Deviation. - O is the Observed (Measured) value. - M is the Mean (Average) of several measurements made in the same way.
Precision and Deviation • Relative Deviation (Dr) - the size of the absolute deviation as a percentage of the mean (average) value.
Precision and Deviation Dr = (Da/M) x 100 • Where: • Dr is the Relative Deviation. • Da is the Absolute Deviation. • M is the Mean (Average) of the set of measurements.
Calculate the Percent Relative Deviation from the bean bag toss • Talk with your team and answer the follow up questions
Scientific Notation • Scientific Notation is also called exponential notation because exponents (powers of 10) are used to make it simpler to write large numbers.
Scientific Notation • Scientific Notation is also called exponential notation because exponents (powers of 10) are used to make it simpler to write large numbers. • Example: 2,300,000 can also be written as 2.3 x 10⁶
Scientific Notation • The first two numbers (2.3) are referred to as the coefficient and consist of the significant figures in the original number. The last number is the power of 10 which is also called the exponent.
Scientific Notation • This method also works for very small numbers. • Example: 0.00045 can also be written as 4.5 x 10⁻⁴
Significant Figures Arrow Rule for Significant Figures 1. If a number does not have a decimal, draw an arrow from the right to the left until you hit a nonzero figure. All figures to the left of the end of the arrow are significant.
Significant Figures Arrow Rule for Significant Figures 2. If a number has a decimal, draw an arrow from the left to the right until you hit a nonzero figure. All figures to the right of the end of the arrow are significant.
Calculations and Significant Figures • After you perform the calculation, the final answer must reflect the value with the fewest significant figures. The least precise measurement controls the number of significant figures.