Understanding Accuracy and Precision in Measurements
This presentation covers the concepts of accuracy and precision in measurements, understanding errors, and calculating absolute and relative errors. Learn how to differentiate between accuracy and precision and measure deviations in measurements. Explore practical examples and formulas to enhance your understanding of measurement accuracy and precision.

Understanding Accuracy and Precision in Measurements
E N D
Presentation Transcript
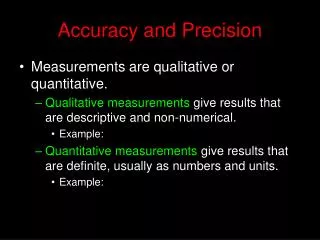
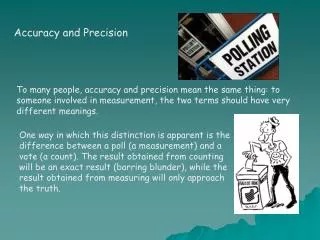
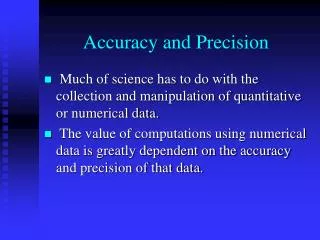
Accuracy and Precision Understanding measurements
Directions • Click F5 to view this power point as a presentation. • This allows you to see the practice math problems done step by step. • If you get the presenter view (see below), you can click on the three dots and then click hide presenter view.
Understanding Error • Some mathematical STATEMENTS are 100% true • (ex: I have 2 sisters, you are 14 years, 7 months, and 6 days old, etc.) • But … every MEASUREMENT encounters ERROR.
Error can occur because: • The equipment isn’t working properly • The person using the equipment is not using it properly • Something interfered with the equipment.
Examples of Interference • Vibrations, drafts, changes in temperature, electronic noise etc.
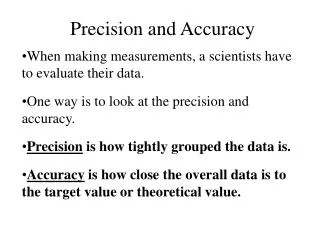
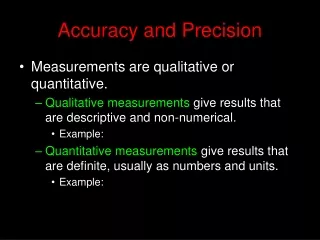
Accuracy When dealing with data collection, we must describe the accuracy of the measurements
Accuracy • Is Correctness! • how close your measurement is to the accepted value. • A highly accurate measurement will be very close to the accepted value.
Error • ERROR is Incorrectness! • The size of the experimental error can be described using mathematics: • Absolute Error (or AE for short) shows how far away the measurement is from the accepted value • Relative Error (or RE for short) turns the size of the error into a percentage.
Formulas Absolute Error = | Accepted Value – Measured Value | Relative Error = |Absolute Error | x 100 Accepted Value
Absolute Value Symbol| | • The two vertical lines represent absolute value. • Absolute value is the magnitude of a real number without regard to its sign. • What does this mean? • After solving, if you have a negative number, ignore the negative sign. |15-18| = 3 15-18 = -3 but because of the || symbols, you ignore the negative sign and only record the 3!
Example #1 Test Results • Let’s suppose you took a 75 point test. You earned 65 points. • What is your absolute error in this case? Abs Error = Accepted Value – Measured Value = 75 – 65 = 10 points
Example #1 Test Results How large was your error for THIS test? (in other words, what was your relative error?) Rel Error = (Abs Error ÷ Accepted Value) x 100% = (10/75)x100% = 13.3333%
Size of Error – Absolute vs Relative: is the error big enough to be of concern or small enough to be unimportant? • Find the AE and RE for each: • A. You ask for 6 pounds of hamburger and receive 4 pounds.B. A car manual gives the car weight as 3132 pounds but it really weighs 3130 pounds.
AE = |accepted – measured|RE = (AE / accepted) x 100*Round to the hundredths (2 decimal places) Example B: 3132 pounds is the accepted value (set by car manual). AE = |3132-3130| AE = 2 pounds RE = (2 / 3132) x 100 RE = 0.06% Example A: 4 pounds is the measured value (what you got). AE = |6-4| AE = 2 pounds RE = (2 / 6) x 100 RE = 33.33%
In which example was a more accurate measurement made? • Example B had a more accurate measurement because their Relative Error was lower. • Both had the same Absolute Error, but by changing it to a percentage (Relative Error), we can compare the error to the accepted value and get a better idea of which is more accurate. • Remember, accuracy is the opposite of error so the lower the error, the more accurate. The higher the error, the less accurate. • The percentage of accuracy would be 100 – RE, therefore A had a 66.67% accuracy while B had a 99.94% accuracy.
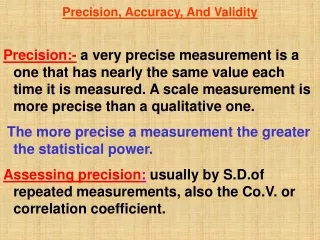
PRECISION • It is consistency and agreement among many of the same measurements • How close measurements are to each other • Compares one measurement to the AVERAGE of the group of measurements. • How spread out the data is The smaller the scatter, the greater the precision.
Deviation Described mathematically using Absolute Deviation and Relative Deviation
Absolute Deviation (AD) shows how far away one measurement is from the average value of many measurements • Relative Deviation (RD) turns the size of the deviation into a percentage.
Absolute and Relative Deviation Absolute Deviation = | Average Value – Measured Value | Relative Deviation = Absolute Deviationx 100 Average Value
ExampleThe class average for a test was 89, and you scored a 96. What was your AD (absolute deviation) and RD (relative deviation)? AD = |Average Value – Measured Value| = 89- 96 = 7 points RD = (Abs Dev / Average Value) x 100% = (7/89)x100% = 7.865 %
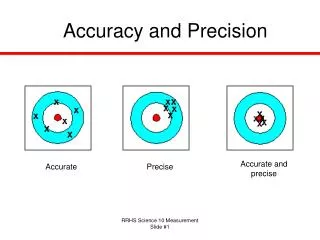
ACCURACY vs. PRECISION • Accuracy is closeness to ACCEPTED VALUE, or being correct • Precision is closeness to the AVERAGE, or being close together
Accuracy vs. Precision • Low Accuracy - but the mark misses the target. • High precision - grouping is tight.
Accuracy vs. Precision • Medium accuracy - mark is averaged around the target. • Low Precision - grouping is scattered.
Accuracy vs. Precision • Low Accuracy- mark misses the target. • Low Precision- grouping is scattered.
Accuracy vs. Precision • High Accuracy- mark is averaged around the target. • High precision- grouping is tight.
Summary • All measurements have uncertainty • Accuracy describes how close a measurement is to an ACCEPTED VALUE • Accuracy is mathematically described using Absolute Error and Relative Error • A high Relative Errormeans low accuracy. • You can’t know accuracy unless you know the Accepted Value • If your measurements are inaccurate, you may want to take them again.
Summary • Precisiondescribes how close a measurement is to the AVERAGE VALUEof a set of data • Precision is mathematically described using Absolute Deviation and Relative Deviation • A low Relative Deviation means high precision. • Both Relative Error and Relative Deviation show a percentage, which allows us to compare two sets of data to see who is more accurate (using RE) or more precise (using RD).