Download
1 / 27
270 likes | 429 Vues
The Mining Sector in Latin America: supporting or undermining social and economic development?. Aidan Davy Program Director Community and Social Development International Council on Mining and Metals. Scope of presentation. ICMM and the Resource Endowment Initiative

E N D
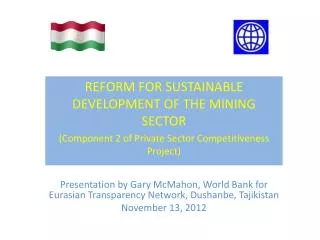
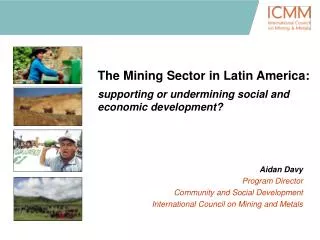
The Mining Sector in Latin America: supporting or undermining social and economic development? Aidan Davy Program Director Community and Social Development International Council on Mining and Metals
Scope of presentation • ICMM and the Resource Endowment Initiative • ‘Mineral dependent’ economies globally and in Latin America – historical economic and social performance • Foreign Direct Investment in extractives in Latin America • More in-depth discussion of economic and social performance of two countries: Chile and Peru • Preliminary conclusions: supporting or undermining social and economic development?
ICMM Corporate Members Goal: Raise Standards of Performance
Resource Endowment Initiative • In 2004, ICMM in partnership with World Bank and UNCTAD commenced research to better understand the socio-economic performance of ‘mineral-dependent’ countries • Focus on identifying and promoting ways to assist mineral-rich countries across the developing world to use their mineral resources to achieve broad-based economic growth and sustainable development • Not ‘resource curse’ denial – but limitations of resource-curse literature is focus on problems rather than solutions • Resource Endowment work attempts to understand factors that contribute to more successful ‘mineral-dependence’
Outputs from Phases 1 and 2 (2004 - 2006) • Toolkit which provides a systematic and consistent approach to documenting impacts of individual mining projects on a local, regional and national level • Practical policy recommendations for mining companies, governments, development institutions and NGOs aimed at enhancing the socio-economic contribution of mining • Country case studies for Peru, Chile, Ghana and Tanzania: • examined the national (macro) economic impact of the mining industry as well as poverty and social indicators • reviewed economic and social impact of one large mine in-depth in each country • Synthesis Report which contrasts and compares similarities and differences, and outlines recommendations 5
First step: determine some measure of ‘success’as basis for more in-depth work • Identified 33 mineral dependent economies globally: • Ores and metals comprising 20% or more of merchandise exports on average over 38 years (1965 and 2003) • For these countries, economic and social performance measured by looking at six variables: • Economic growth - GDP per capita for 32 years [1970-2002] • Economic diversification - non-mineral GDP growth [1980-2002] • Poverty alleviation (4 variables - infant mortality rate, HDI, minimum dietary requirements, and access to drinking water) • Results for individual countries compared with global income group and region [e.g. Chile compared with all “upper middle” income countries and Latin America]
Poor performers Weak performers • Bolivia • Central African Republic • D. R. Congo • Liberia • Niger • Papua New G. • Philippines • Sierra Leone • Zambia • Gabon (E&S) • Guyana (E) • Jordan (S) • Mauritania (E) • Peru (S) • South Africa (E) • Suriname (S) • Tanzania (E) • Togo (S) • Zimbabwe (S) Generally better • Colombia • Guinea • Jamaica • Mali • Morocco • Mozambique • Namibia • Senegal Better performers • Botswana • Chile • Ghana • Malaysia • Mexico • Tunisa Analysis of E&S well-being of 33 mineral- dependent* economies [1965 – 2003] Economic factors:Per capita GDP growth and non-mineral GGP growth (1980 – 2002) Poverty alleviation: Infant mortality, human Development Index and two selected MDGs * Minerals and ores exports exceeded 20% of total exports
Recent mineral dependence of LAC countries Minerals as % of exports (2000-2005) Minerals as % of exports (1990-1999) Suriname Peru Jamaica Guyana Colombia Chile Brazil Bolivia 0 10 20 30 40 50 60 70 Note: Mineral exports in Peru significantly increased in recent years (62% in 2006)
Macroeconomic outcomes in Chile: Higher and more stable GDP growth • Nationalisation in 1970’s followed by dominance of state ownership until later 1980s • Improved mineral legislation enacted in Chile during Pinochet years (mid-1970s). But greater political and economic stability needed before recovery of mining investment in the late ’80’s/early ’90’s • Stability enabled significant FDI from late ‘80’s/early ‘90’s ($21.7bn FDI & 14.5bn Codelco) and a 3-fold production increase (’90-’04) • Substantial recovery in mining investment appears to have contributed to improved growth performance [more notable link to improved mineral legislation in Ghana] • Non-mineral GDP growth has been positive. Over past 30 years Chile’s non-mineral GDP growth has outperformed LAC and upper-middle income countries • Copper Stabilisation Fund (since 1985) helped smooth out variations in fiscal income. This has made planning for long term spending decisions easier, for example to build human capital.
Chile – current state of mineral dependence • Over past 30 years Chile’s non-mineral GDP growth has outperformed LAC and upper-middle income countries • Mineral exports still significant, but long-term decline indicative of value of other exports [long-term GDP decline of 8% to 6.4% ’05]
Mining and fiscal revenues - Chile 7000 6000 15% 5000 4000 10% % of fiscal revenues US$ millions 3000 2000 5% 1000 2003 1991 - 2002 2004 2005 2006 Taxes paid by Codelco Taxes paid by the 10 largest private mining enterprises Codelco dividends % of fiscal revenues derived from mining Sources: UNCTAD (2007) World Investment Report. ECLAC (2007). Economic survey of LAC: 2006 - 2006
Social Development/Poverty Reduction: Outcomes in Chile • Reduction in poverty levels have been significant at both national and regional levels in Chile (see next slide). Region II outperformed all others on non-monetary Human Development Indicators • Proportion of people living below the poverty line has decreased from nearly 40% in 1990 to about 20% in 2002. Improvements were largely driven by increasing employment opportunities • Region II shows unusually strong linkages between mining industry and the local economy • This is partly a result of deliberate targeting and fostering of local suppliers by Escondida mine, coupled with regional government initiative promoting industry-government collaboration to support local suppliers obtaining ISO certifications • Benefits of mining sector for Chile have not mainly come from taxes
Chile – Regional differences in poverty reduction Chile poverty reduction by region (1990 – 2003)
Employment, training & local procurement:Example of Escondida mine • In 2004, Escondida mine (Region II) employed 2,810 directly (8 expatriates) and 2,345 contractors • Induced employment estimated as 8,500 - 12,800 (or 5 - 6.7% of occupied people in Region II) • Average annual spending on training and development was approx $2,000.employee • On average, procurement from within Chile is estimated as 80%: • In 2004, of $483m of goods procured, 48% was from within Region II, 34% from elsewhere in Chile, and 18% overseas
Macroeconomic outcomes in Peru: greater economic stability • Nationalisation in late ’60’s and during ‘70’s followed by dominance of state ownership until early 1990’s • Fujimori administration adopted policy of privatization and encouraged FDI. After introduction of new mining legislation in 1992, $9.8bn FDI in sector (between 1992-2004) • Mining in Peru makes a crucial economic contribution: approximately 55% of merchandise exports and 5% of GDP in 2006 • Between 1990-2006, Peru’s overall GDP increased by 93% whereas mining-related GDP increased by 135% • Mining contributed around 21% of Peru’s fiscal revenues in 2006 (a very large increase from around 5% in 2004) • While direct employment small ….65% of procurement from the industry in Peru is sourced in-country • Overall, sector employs 95,000 directly, but 380,000 indirectly (with mining salaries averaging 7.5 times agricultural salaries)
Income taxes and extractives, Peru (2000–2006) 2000 60 1800 50 1600 1400 40 1200 US$ millions 1000 30 800 20 600 400 10 200 0 0 2000 2001 2002 2003 2004 2006 2005 Income tax revenue from mining industry Income tax revenue from oil and gas industry % of total income tax revenue derived from extractives Source: UNCTAD (2007) World Investment Report
Social Development/Poverty Reduction: Outcomes in Peru • Official statistics show that from 1960’s to 2002, 3 key social indicators - infant mortality, life expectancy and literacy rates - have generally improved • UNDP’s 2004 Report on Human Development found little progress in reducing social inequality and disparities in income and regional development • More than half population lives in poverty and nearly a quarter lives in extreme poverty – extreme poverty affects more than half of the rural population, compared to slightly less than 10% of urban • Social exclusion is deeply entrenched, many social needs are unmet, and mining companies bear brunt of expectations
National level governance reforms in Peru are not matched at regional/local levels…. Important recent developments: Canon Minero: 50% of corporate income tax returned to mining areas; this is significant contribution (over $900m in 2006) Mining Royalty: 1-3% value of production, 100% to mining areas Voluntary Support Fund (VSF): $790 million over five years to reduce poverty and social exclusion in mining areas But… proactive arrangements are needed where capacity of local and regional governments need strengthening Companies can support capacity building, e.g. integrating social investment into local/regional government development plans 19
Voice & Accountability Political Stability Govt. effectiveness Regulatory Quality Rule of Law Control of Corruption Role of/impact on governance (1996 – 2006) LAC region (1996) Chile (1996) Peru (1996) LAC region (2006) Chile (2006) Peru (2006)
Overall conclusions • The contribution of FDI and mining investments to socio-economic development and poverty reduction can be significant • The performance of different mineral dependent countries varies greatly, but apparent success factors include: • A stable macroeconomic climate • Mineral legislation supportive of FDI • Good governance and institutional capacity – especially at local and regional levels • Effective partnerships between companies and governments – in fostering local supply chains, for example, or improving local social provision • A mining resurgence can be associated with significant poverty reduction…. But this is by no means an automatic outcome
How can Improved Outcomes be Achieved? • Deeper governance reforms that improve broad-based access to economic opportunities are critical to:(a) help limit negative effects, and (b) capitalise on positive growth opportunities • This applies in particular to the local level. Strengthened decentralised fiscal management and empowerment of local and regional authorities are needed – capacity must be built in parallel • Caution: Explicit revenue sharing arrangements, as found in Ghana and Peru, do NOT seem to respond adequately to this. They overemphasise redistribution, but contribute little towards improving the efficiency of spending • Institutional arrangements needed that support broad-based economic activities in the medium and long term: • To fill gaps, all partners (companies, governments, social representatives and donors) need to collaborate and adapt to country specific situations.
Way Forward • Collaborative action is needed to capture the full potential benefits of mineral wealth and achieve enhanced and lasting outcomes • This requires partnership approaches between companies, governments, social representatives (including NGO’s) and donor agencies • Individual partners have specific responsibilities, comparative advantages, and contributions to make – but collaboration is fundamental • These principles apply to each of the five clusters of recommendations
Resource Endowments 5 recommendations for collaborative action focus on: • Mining and Economic Development • Mining and Poverty Reduction • Social Investment and Compensation • Dispute Resolution and Communication • Artisanal and Small-Scale Mining • The clusters in the Synthesis Report identify actions and responsibilities for (i) companies, (ii) host governments, and (iii) development organisations and the voluntary sector. • Of course, emphases differ by country.
For further information…. ICMM 35 Portman Square London W1H 6LR United Kingdom Telephone: +44 (0) 20 7467 5580 Fax: +44 (0) 20 7467 5581 Email: aidan.davy@icmm.com
ICMM working to translate recommendations into reality Example of recommendations: on dispute resolution From recommendations to reality • Pilot projects in Ghana, Peru & Tanzania will: • Map existing partnerships in each country against initiative’s recommendations (6 areas) to identify gaps • Convene multi-stakeholder workshops to agree action plan / new partnerships so as to help fill gaps • Also in-depth study of effect of mining tax regimes on development • Additional international & national dissemination to encourage uptake of recommendations
0 10 1,000 10,000 -100 -10 100 Suriname Peru (8%) Jamaica (16%) Guyana Colombia (23%) Chile (9%) Brazil (9%) Bolivia 0 10 1,000 10,000 -100 -10 100 Inward FDI flows to selected LAC countries Minerals FDI (2003-2005) – US$4.7 bn Total FDI (2003-2005) US$ millions