Signal Sampling and FFT Problem Solutions for Data Acquisition System Components
60 likes | 149 Vues
Explore the solution to a signal sampling and FFT problem in the context of data acquisition system components, including analog I/O, digital I/O, counter/timer I/O, and signal conditioning.

Signal Sampling and FFT Problem Solutions for Data Acquisition System Components
E N D
Presentation Transcript
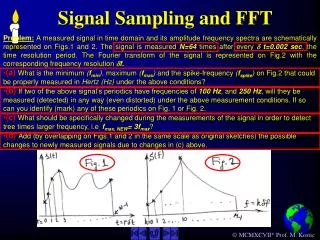
Signal Sampling and FFT • Problem:A measured signal in time domain and its amplitude frequency spectra are schematically represented on Figs.1 and 2. The signal is measured N=64 times after every d t=0.002 sec, the time resolution period. The Fourier transform of the signal is represented on Fig.2 with the corresponding frequency resolution df. • (a) What is the minimum (fmin), maximum (fmax) and the spike-frequency (fspike) on Fig.2 that could be properly measured in Hertz (Hz) under the above conditions? • (b) If two of the above signal’s periodics have frequencies of 100 Hz, and 250 Hz, will they be measured (detected) in any way (even distorted) under the above measurement conditions. If so can you identify (mark) any of these periodics on Fig. 1 or Fig. 2. • (c) What should be specifically changed during the measurements of the signal in order to detect tree times larger frequency, i.e,fmax, NEW= 3fmax? • (d) Add (by overlapping on Figs.1 and 2 in the same scale as original sketches) the possible changes to newly measured signals due to changes in (c) above.
Data Acquisition - DAQ • DAQ boards: • Analog I/O • Digital I/O • Counter/timer I/O • DAQ library supports all DAQ boards • LabVIEW uses the NI-DAQ driver-level software • Data Acquisition System Components COMPUTER with SOFTWARE:Control the DAQ board, process, store, and display data, as instructed by software program.Examples:LabVIEW application programs to acquire data, simulate instruments, and generate results, etc. SIGNAL CONDITIONING: Modify transducer signals to match DAQ board specs/ranges.Examples: amplification or attenuation, filtering, excitation, etc. PLUG-IN DAQ BOARD: Measures (acquires), processes, stores, and generates signals, as instructed by software program.Examples: Analog and digital signals’ input and output, counters, timers, etc. TRANSDUCERS: Sense the measured quantities and change their properties or generate corresponding electrical signals.Examples: strain gage, thermocouple, accelerometer, potentiometer, etc.
Sampling, Minimum & Maximum/Nyquist Frequencies - Solution (2) fp2=2500 9fNyq 7fNyq fp1=1200 5fNyq 3fNyq fNyq=250 Fp2,al=0 Fp1,al=200
What to do… to detect 3 times lager max. frequency? fNEW, if NNEW=N d d tNEW d d f t