Enhancing Clinical Decision-Making Through KBM2L: Extracting Patterns for Explanations
240 likes | 361 Vues
This presentation discusses a novel approach to clinical decision-making by utilizing KBM2L lists to extract regularity patterns from complex decision tables, particularly in the context of non-Hodgkin lymphoma treatment selection. By organizing knowledge more effectively, we provide clear explanations of optimal treatment strategies derived from influence diagrams. The emphasis is on bridging the gap between large data sets and actionable clinical insights, enhancing understanding and validation processes in real-world scenarios.

Enhancing Clinical Decision-Making Through KBM2L: Extracting Patterns for Explanations
E N D
Presentation Transcript
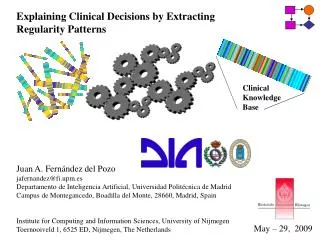
Clinical Knowledge Base Explaining Clinical Decisions by Extracting Regularity Patterns Juan A. Fernández del Pozo jafernandez@fi.upm.es Departamento de Inteligencia Artificial, Universidad Politécnica de Madrid Campus de Montegancedo, Boadilla del Monte, 28660, Madrid, Spain Institute for Computing and Information Sciences, University of Nijmegen Toernooiveld 1, 6525 ED, Nijmegen, The Netherlands May – 29, 2009
Explaining Clinical Decisions by Extracting Regularity Patterns Introduction • When solving clinical decision-making problems with • modern graphical decision-theoretic models such as • influence diagrams, we obtain decision tables with optimal • decision alternatives describing the best course of action • for a given patient or group of patients • For real-life clinical problems, these tables are often extremely • large and this is an obstacle to understanding their content • We propose KBM2L lists are structures that minimize memory • storage requirements for these tables, and, at the same time, • improve their knowledge organization
Explaining Clinical Decisions by Extracting Regularity Patterns Introduction • The resulting improved knowledge organization can be • interpreted as explanations of the decision-table content • We explore the use of KBM2L lists in analyzing and • explaining optimal treatment selection in patients with • non-Hodgkin lymphoma of the stomach using an • expert-designed influence diagram as an experimental vehicle • The selection of the appropriate treatment for non-Hodgkin • lymphoma of the stomach is, as for many other types of • cancer, difficult, mainly because of the uncertainties involved • in the decision-making process
Explaining Clinical Decisions by Extracting Regularity Patterns Introduction • We look at an expert-designed clinical influence diagram • as a representation of a body of clinical knowledge • This diagram can be analyzed and explained using KBM2L lists • It is shown that the resulting lists provide high-level • explanations of optimal treatments for the disease • These explanations are useful for finding relationships • between groups of variables and treatments • It is demonstrated that these lists can act as a basis for gaining • a deeper understanding of the underlying clinical problem
Explaining Clinical Decisions by Extracting Regularity Patterns Introduction This talk proposes a method to produce explanations for the optimal policies of decision-making problems solved by means of Influence Diagrams • The main reasons are: • the exponential size of the decision tables and • the need of knowledge synthesis • the need of useful explanations for the expert users • and support for the validation process
Explaining Clinical Decisions by Extracting Regularity Patterns Introduction • Our approach is similar to other techniques like: • tree-based classifiers • oblivious read-once • decision graphs • rough sets But the decision tables have not uncertainty and all cases are correctly classified by the inferred model • We rebuild the decision tables as a list and • search the best configuration: • minimum storage space and • maximum explanation performance A realistic clinical model allows us to show how our method extracts patterns from the decision tables and sets the explanations. Gastric NHL model: non-Hodgkin lymphoma of the stomach.
Explaining Clinical Decisions by Extracting Regularity Patterns Introduction • DECISION SUPPORT SYSTEMS • - A system (software) that supports the decision process • - Domain knowledge representation, problem specification, • evaluation of solutions, explanation and sensitivity analysis • INFLUENCE DIAGRAM (ID) • - Probabilistic graphical model of a decision problem • - Decision strategy tables (DST) • EXPLANATION (EX) • - Why the DSS shows a particular feature set? • What the implicit rules underlying the modelled • decision problem are?
Explaining Clinical Decisions by Extracting Regularity Patterns Introduction Decision Problem ID (Model) Evaluation DST (Knowledge) KBM2L Knowledge Base User Decision Support Interface System
Explaining Clinical Decisions by Extracting Regularity Patterns Introduction DST KBM2L • Knowledge Base Representation Synthesis Explanation Validation Multidimensional Matrix to List ITEM granularity Relevant Attribute Subset Expert Reasoning Rules
Using KBM2L lists for explanation purposes Fernandez del Pozo, J.A., Bielza, C., Gomez, M.: A List-Based Compact Representation for Large Decision Tables Management. European Journal of Operational Research, volumen 160, Special Issue on Decision Making and AI, (2005) 638-662 Basic concepts: KBM2L --- Knowledge Base Matrix to List • Every DST is arranged in a multidimensional matrix and • consecutive cells with the same optimal alternative are grouped • We search the lists with fewer groups (ITEMS) regarding the index • of the cells, when a particular order (BASE) in the variable set, • and the values of their discrete domains are choosen
Using KBM2L lists for explanation purposes Basic concepts: KBM2L --- Knowledge Base Matrix to List Optimal BASE Minimum ITEM length. Optimal BASE Heuristic Search + GA +VNA • Explanations using relevant variables • Each ITEM has two extreme cases (Iinf, ISup) that explain its • optimal alternative: Iinf ISup • The BASE classifies the variables as relevant if their values are • the same in both extreme cases
…0 0 0 X …0 0 1 X …0 1 0 X …0 1 1 Y …1 0 0 X …1 0 1 X …1 1 0 X …1 1 1 Z …0 0 0 X …0 0 1 X ……….. KBM2L • The ID evaluation yields a DST • defined by its attributes (and their domains) with • all configurations: ....A0 A1 A2 • Each strategy consists of: • an attribute configuration • an optimal alternative index • We can arrange the list of strategies • according to any order on the attribute set (base) • All adjacent strategies are grouped if they have the same • optimal alternative; one configuration represents the group 12
KBM2L [A0,A1,A2] [A1,A0,A2] [A2,A1,A0] ……. [A0,A2,A1] • An order change (base permutation) may induce a • specific knowledge granularity <(...),...| DST {A0,A1,A2} 0 0 0 X 0 0 1 X 0 1 0 Y 0 1 1 X 1 0 0 X 1 0 1 Z 1 1 0 X 1 1 1 X [A0,A1,A2] • The most compact • KBM2L allows • to extract general and • concise explanations [A1,A0,A2] < (001), X| < (010), Y| < (100), X| < (101), Z| < (111), X| < (010), X| < (011), Z| < (100), Y| < (111), X| X (00_) (010) X (11_) (101) Explanation is the set of constant values in the index X (00_) X (011) (100) X (11_) 13
The Gastric non-Hodgkin Lymphoma Diagram Lucas, P., Boot, H., Taal, B.: Computer-Based Decision-Support in the Management of Primary Gastric non-Hodgkin Lymphoma. Methods of Information in Medicine, 37 (1998) 206-2 Chronic infection Helicobacter pylori. 5% of gastric tumors. The model can make a diagnosis and suggest a treatment.
The Gastric non-Hodgkin Lymphoma Diagram • The influence diagram • 17 chance nodes (ellipses), 1 value node (diamond) and 3 • decision nodes (rectangles). • 42 arcs, 8,282 probability entries and 144 utility entries. The evaluation results: attributes and values helicobacter-treatment (HT)No, Yes surgery (S)None, Curative, Palliative ct-rt-schedule (CTRTS)None, Radio, Chemo, Ch.Next.Rad general-health-status (GHS)Poor, Average, Good clinical-stage (CS)I, II1, II2, III, IV bulky-disease (BD)Yes, No histological-classification (HC)Low.Grade, High.Grade helicobacter-pylori (HP)Absent, Present clinical-presentation (CP)None, Hemorrhage, Perforation, Obstruction
Results: Optimal Decision Tables and KBM2L List HT: [CS,BD,HC,HP], 40 cases, 17 items 32 cases – HT=No, 8 cases – HT=Yes S: [GHS,HT,CS,BD,HC,HP,CP], 960 cases, 385 items 663 cases – S=None, 297 cases – S=Curative CTRTS: [GHS,S,HT,CS,BD,HC,HP,CP], 2880 cases, 678 items 490 cases – CTRTS=None, 668 cases – CTRTS=Radio, 1404 cases – CTRTS=Chemo, 124 cases – CTRS=Ch.Next.Rad Evaluation of the ID yielded 3 decision tables each containing the optimal treatment for each combination of attributes.
Example of table HT: ODT and KBM2L, Opt-KBM2L 0 0 0 0 0 0 0 0 1 1 0 1 0 0 0 0 1 0 1 1 1 0 0 0 0 1 0 0 1 1 1 1 0 0 0 1 1 0 1 1 2 0 0 0 0 2 0 0 1 1 2 1 0 0 0 2 1 0 1 1 4 0 0 0 0 4 0 0 1 1 4 1 0 0 0 4 1 0 1 1 4 1 1 1 0 0 0 4 1 0 0 1 2 1 1 0 1 3 1 0 0 1 4 1 1 1 1 4 1 0 0 0 0 00 0 0 0 1 1 0 0 1 0 0 0 0 1 1 0 0 1 0 0 0 0 1 0 1 1 0 1 1 0 0 0 1 1 1 0 1 0 0 0 0 1 0 0 1 1 1 0 1 0 0 1 0 1 1 0 1 1 0 0 0 1 1 0 1 1 1 1 1 0 0 1 1 1 1 0 2 0 0 0 0 2 0 0 1 1 2 0 1 0 0 2 0 1 1 0 2 1 0 0 0 2 1 0 1 1 2 1 1 0 0 2 1 1 1 0 3 0 0 0 0 3 0 0 1 0 3 0 1 0 0 3 0 1 1 0 3 1 0 0 0 3 1 0 1 0 3 1 1 0 0 3 1 1 1 0 4 0 0 0 0 4 0 0 1 1 4 0 1 0 0 4 0 1 1 0 4 1 0 0 0 4 1 0 1 1 4 1 1 0 0 4 1 1 1 0 Optimal KBM2L (5 items) [HP,HC,CS,BD] KBM2L (17 items) [CS,BD,HC,HP] DST (40 cases) [CS,BD,HC,HP]
Results: Optimal Decision Tables and KBM2L List HT: [HP,HC,CS,BD], 40 cases, 5 items 3 items – HT=No, 2 items – HT=Yes S: [CP,GHS,BD,CS,HC,HP,HT], 960 cases, 21 items 11 items – S=None, 10 items – S=Curative CTRTS: [GHS,S,HT,CS,BD,HC,HP,CP], 2880 cases, 218 items 49 items – CTRTS=None, 69 items – CTRTS=Radio, 85 items – CTRTS=Chemo, 15 items – CTRS=Ch.Next.Rad By means of the Variable Neighbourhood algorithm, the same cases are now arranged in fewer items
Results: The global KBM2L for the gastric NHL protocol (HT, S, CTRTS): B0[BD,HP,GHS,CS,CP,HC] 340 items (HT, S, CTRTS): Bf[HP,HC,CP,CS,BD,GHS] 195 items (HT,S,CTRS) B0 Bf No, None, None 12 7 No, None, Radio 44 31 No, None, Chemo 88 40 No,Curative,None 41 26 No,Curative,Radio 44 34 No,Curative,Chemo 11 13 No,Curative,Ch.Next.Rad 4 4 (HT,S,CTRS) B0 Bf Yes, None,None 3 1 Yes,None,Radio 34 13 Yes,None,Chemo 27 9 Yes,Curative,None 22 10 Yes,Curative,Radio 7 6 Yes,Curative,Chemo 3 1 The items in the optimal lists are the rules of the clinical protocol
The Gastric non-Hodgkin Lymphoma Diagram • The difference between rule 80 (1 case) and 81 (1 case), CTRTS, • can be explained by the GHS value, Average and Good. • The difference between rules 125 (3 cases) and 127 (3 cases), HT, • can be explained by the CS value, III and IV. GHS is not relevant
The Gastric non-Hodgkin Lymphoma Diagram • Focusing on one treatment, a new organisation is sought • distinguishing only a pair of possible treatments T and ¬T. • Four ITEMS with (HT: No, S: Curative, CTRTS: Ch.Next.Rad) • are grouped on a new base [GHS,HC,CP,BD,CS,HP] in one • ITEM (12 cases) and are explained by GHS (Good), • HC (High.Grade), CP (Perforation) and BD (No). • Rule 3 (15 cases) say (HT: No, S: None, CTRTS: Chemo) • because HP is Absent, HC is Low.Grade, CP is None and • CS is II2, III or IV. • Variables BD and GHS are not relevant
Software KBM2L Schema Items/Family Cases/Table Families TASKS Cases/Family Items/KBM2L Base Espectrum Options
Explaining Clinical Decisions by Extracting Regularity Patterns Conclusion • A good organisation of such tables reduces the memory • required to store them. • Also finds out which key attributes are able to explain • the treatment suggestions. • Explanations are useful during the refinement of the • influence diagram • In the future we will use this framework to perform • Sensitivity Analysis Research supported by Ministry of Science and Technology, (Spain) Project DPI2001-3731.
Clinical Knowledge Base Explaining Clinical Decisions by Extracting Regularity Patterns Concha Bielza, J. A. Fernández del Pozo and Peter J. F. Lucas. Explaining clinical decisions by extracting regularity patterns. Decision Support Systems (Elsevier) ISSN: 0167-9236, Vol 44(2) 397--408 Thank You Any Questions?