Download
1 / 51
510 likes | 704 Vues
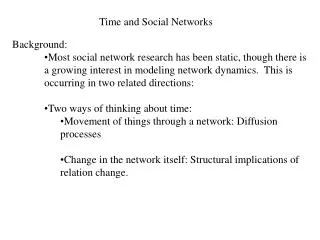
Time and Social Networks. Background: Most social network research has been static, though there is a growing interest in modeling network dynamics. This is occurring in two related directions: Two ways of thinking about time: Movement of things through a network: Diffusion processes

E N D
Time and Social Networks • Background: • Most social network research has been static, though there is a growing interest in modeling network dynamics. This is occurring in two related directions: • Two ways of thinking about time: • Movement of things through a network: Diffusion processes • Change in the network itself: Structural implications of relation change.
Time and Social Networks Historically, time has been incorporated into the network by looking at (a) changes in the distribution of an item over the population, over time (I.e. the adoption of an innovation, the spread of an idea, etc.) (b) different cross-sectional slices of the network (I.e. world system in 1965, 1975, 1985 or protest networks over time). These approaches take us a long way. They don’t allow us to explicitly model the changes within the network, or explain changes in the distribution of goods as a function of relationship timing. This static bias is built into some views of the network (think of Wellman’s definition as patterns of stable relations. What we want is to be able to account for the dynamics of the network in “real time” -- to account for changes in relations as a function of changes in relations occurring around ego.
Time and Social Networks Examples of looking at change in networks: Roy and interlocking directorates (ASR 1983, 248-257) Non-financial interlocks: 1886 - 1890
Time and Social Networks Examples of looking at change in networks: Roy and interlocking directorates (ASR 1983, 248-257) Non-financial interlocks: 1891 - 1895
Time and Social Networks Examples of looking at change in networks: Roy and interlocking directorates (ASR 1983, 248-257) Non-financial interlocks: 1896 - 1900
Time and Social Networks Examples of looking at change in networks: Roy and interlocking directorates (ASR 1983, 248-257) Non-financial interlocks: 1901 - 1905
3 2 2 1 6 1 3 5 4 5 4 2 6 5 5 1 3 7 4 3 7 1 2 4 6 1 2 3 (‘81-83) 4 Bearman and Everett: The Structure of Social Protest 7 5 6 (‘66-68) (‘61-63) (‘71-73) (‘76-78) See paper for group compositions
Freeman’s display of (Weller and Romney, 1990) MDS of the Fraternity data
Freeman’s animation of change based on an early ‘email’ system in the 1970s. (note: the animation runs twice: once without groups, once by groups)
All of these are descriptive techniques. We want to be able to model and understand the change in a network as a function of the network itself - the structural forces of social change. • The most obvious place to start is social balance theory, and some work has attempted this. See the bibliography, but authors include: • Hallinan • Doreian • Leenders • Snijders • Stokman
Doreian, Kapuscinski, Krackhardt & Szczypula:A breif history of balance through time. Reanalyzes the Newcomb fraternity data, to look at changes in social balance over time. The basic balance theory hypothesis is that people who find themselves in an unbalanced position should change their relations to generate balance. Hypothetically, this should lead to greater balance over time. After discussing a set of problems imposed because the data are forced ranks, they first look at simple reciprocity.
Doreian, Kapuscinski, Krackhardt & Szczypula:A brief history of balance through time.
Doreian, Kapuscinski, Krackhardt & Szczypula:A brief history of balance through time.
Doreian, Kapuscinski, Krackhardt & Szczypula:A brief history of balance through time. Relational Stability 40 30 % Change in ties 20 10 0 1 2 3 4 5 6 7 8 9 10 11 12 13 14 Week
Doreian, Kapuscinski, Krackhardt & Szczypula:A brief history of balance through time. In addition to the simple degree of transitivity, they want to measure whether the structure as a whole conforms to the prediction of structural balance. They identify groups by partitioning the network to minimize the number of negative ties within group and the number of positive ties between group (this algorithm is implemented in PAJEK). They can then measure structural imbalance as the sum if departures for structural balance (2 and only 2 groups) and generalized balance (greater than 2 groups).
Doreian, Kapuscinski, Krackhardt & Szczypula:A brief history of balance through time. Extent of Structural Imbalance 17 Structural Imbalance Generalized Imbalance 15 13 11 9 1 2 3 4 5 6 7 8 9 10 11 12 13 14 15 Week
Doreian, Kapuscinski, Krackhardt & Szczypula:A brief history of balance through time. They point out that the dynamic action of individuals had group implications, which is part of what makes balance so attractive. “…the micro-level processes can be viewed as generating social forces that move the structure toward group balance.” They also point out that negative ties within groups are likely less tolerated than positive ties between groups, as negatives within group may threaten the group in ways that positive ties between groups do not.
An extension: A balance model of friendship change among adolescents The basic hypothesis of social balance is that people will make choices that bring the entire group into balance. But, consider how a given relationship looks from different perspectives: A transition that generates transitivity for one person can generate intransitivity for another. As such, there is no guarantee that friendship change will result in a globally balanced outcome.
Here, we see that it is possible, even within the triad, for a transition to be transitive, but the state to be negative, which implies that one person’s transitive change is another’s intransitive. Vacuous 030C 120C 102 Transitive Intransitive 111U 021C 201 012 111D 300 003 210 021D 120U 030T 021U 120D
What are the implications for relationship change if people follow transitivity, from their own point of view? I used a simulation, based on data from Add Health, to answer this question. Strong transitive and intransitive rules: Results in cliques forming quickly and maintaining over time.
Moderate values for seeking transitivity and avoiding intransitivity: Results in a fluid network structure.
Other Extensions: Most of the modeling work on network dynamics has asked a statistical question: what is the likelihood of seeing the time 2 network, given the structure at time 1? This is implemented in Snijders’ program (go to the INSNA web site, and link from there) for small networks. A related question has to do with random walks. Given that relations change ‘at random’, what trends in the shape of the network should we see?
A zero-one random walk: Rule: if heads - add one; if tails - subtract one
A zero-one random walk: Rule: if heads - add one; if tails - subtract one
Diffusion through networks, when the network can change. A long tradition in network research focuses on social diffusion: how ideas, information or goods travel through a network. In almost all cases, the diffusion models rest on a network that is assumed to be constant. What are the implications for diffusion when the network structure can change? It turns out, that the timing of relations can have a huge impact on the possibility that things flow through the network. Best introduction to diffusion models: Coleman’s Introduction to Mathematical Sociology text Tom Valente’s Network Models of the Diffusion of Innovation
Coleman, Katz and Menzel, “Diffusion of an innovation among physicians” Sociometry (1957) 1 > 3 nominations 0.8 1 - 2 noms 0.6 Cumulative % using “Gammanym” 0.4 0 nominations 0.2 0 2 4 6 8 10 12 14 16 18 Week since introduction
A hypothetical Sexual Contact Network 8 - 9 E C 3 - 7 2 - 5 A B 0 - 1 3 - 5 D F
The path graph for a hypothetical contact network E C A B D F
Implied Contact Network of 8 people in a ring All relations Concurrent
Implied Contact Network of 8 people in a ring Mixed Concurrent 2 3 2 1 1 2 2 3
Implied Contact Network of 8 people in a ring Serial Monogamy (1) 1 8 2 7 3 6 5 4
Implied Contact Network of 8 people in a ring Serial Monogamy (2) 1 8 2 7 3 6 1 4
Implied Contact Network of 8 people in a ring Serial Monogamy (3) 1 2 2 1 1 2 1 2
Identifying the Minimum Path Density of a Graph It turns out that the safest network is one where relations are ‘inter-woven’ in a “early-late-earlier” pattern. To identify the paths empirically, you must search all possible paths in the network.
Find reachable pairs by walking through all possible paths, stopping when you back up in time.
Implications of Time-ordered Networks • Any measure calculated on the adjacency structure that rests on reachability or flow may be misleading. • There are highly non-linear effects to changing the timing of a relation on total reachability • Within connected components, time order may partition the network into reachable sub-groups. • Infection risk can be assessed on a continuum from complete concurrency to some minimum level of reachability in the network.
Alternative measures: Relative Reach Conditional Reachability (Harary, 1983)
Identifying the Minimum Path Density of a Graph A 2-regular graph t2 t2 t2 t1 t1 t1 t1 t2 t2 line cycle
Identifying the Minimum Path Density of a Graph A 3-regular spanning tree l= 7g
t3 t3 t3 t2 t2 t2 t2 t2 t2 t2 t2 t2 t1 t1 t1 t1 t1 t1 t1 t1 t1 t3 t3 t3 t3 t2 t2 t1 t1 t2 t2 t2 t2 t2 t2 t2 t1 t1 t1 t1 t1 t1 t1 t3 t3 t3 t3 t3 t3 t3 t3 t3 t3 t3 t3 t3 t3 t3 t3 t3 Identifying the Minimum Path Density of a Graph A 3-regular grid Each person can reach 4 people indirectly., leading again to 7g total arcs per person.
2 6 10 t2 t1 t2 t1 t2 t1 t3 t3 t3 t3 t3 t3 1 4 5 8 9 12 t3 t2 t1 t2 t1 t2 t1 3 7 11 Identifying the Minimum Path Density of a Graph A 3-regular linked clusters
Reachability as a function of relationship adjacency Identified paths: For a regular graph with d()=T t1 t2 t1 t3 t2 t3 t1 t2 t3