Aims
Cochrane Systematic Reviews & Cochrane Oral Health Group Luisa Fernandez Anne-Marie Glenny Cochrane Oral Health Group, University Dental Hospital of Manchester Emma Tavender Cochrane EPOC Satellite, Melbourne Australia. Aims. To discuss the role of Cochrane systematic reviews and meta-analyses


Aims
E N D
Presentation Transcript
Cochrane Systematic Reviews & Cochrane Oral Health GroupLuisa FernandezAnne-Marie GlennyCochrane Oral Health Group, University Dental Hospital of ManchesterEmma TavenderCochrane EPOC Satellite, Melbourne Australia
Aims To discuss the role of Cochrane systematic reviews and meta-analyses Cochrane Oral Health Group – progress, undertaking a systematic review with the group & looking to the future
Cochrane Systematic Reviews & Oral HealthAnne-Marie GlennyCochrane Oral Health Group, University Dental Hospital of Manchester
What are systematic reviews? • The process of systematically locating, appraising and synthesising evidence from scientific studies in order to obtain a reliable overview • Aim to find all studies addressing the review’s question using an objective and transparent process
Why are they important ? • Reduce large quantities of information into manageable portions • Formulate policy and develop guidelines • Efficient use of resources • Increased power/precision • Limit bias and improve accuracy
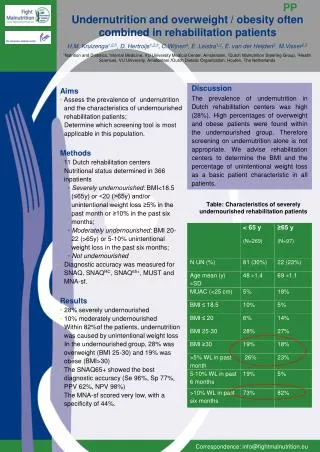
A. Thrombolytic Therapy Textbook/Review Recommendations Odds Ratio (Log Scale) Routine Specific Rare/Never Experimental Not Mentioned Cumulative 0.5 1 2 Year RCT Pts I I I I I I I I I I I 1 23 1960 2 85 1965 3 149 4 138 1970 7 1783 10 2544 11 2651 1975 15 3311 17 3929 22 5452 23 5767 1980 27 6125 30 6346 1985 33 6571 43 21050 54 22051 65 47185 67 47531 1990 70 48154 21 8 1 10 1 2 2 8 7 8 1 12 1 8 4 1 7 3 5 2 2 1 15 8 1 6 1 p<.01 p<.001 p<.00001 Favours Treatment Favours Control
Systematic review • Structured process involving several steps: • Well formulated question • Comprehensive data search • Unbiased selection and abstraction process • Validity assessment of papers • Synthesis of data
Well formulated question • Participants • Interventions (Exposure) • Comparisons • Outcomes
Well formulated question • Participants • Interventions • Comparisons • Outcomes Pit and fissure sealants versus placebo for the prevention of dental caries in permanent teeth in children and adolescents
Inclusion criteria • Participants • Interventions • Comparisons • Outcomes • Study design/methodological quality
What type of study design? How effective is paracetamol at reducing pain? Does smoking increase the risk of oral cancer?
STRONGExperimental studies/ clinical trials Randomised controlled trials Non-randomised controlled trials Observational studies Cohorts Case-controls Cross-sectional surveys Case series Case reports WEAKExpert opinion, consensus
Search strategy • Needs to be as comprehensive as possible • Consider • Electronic databases (Cochrane Controlled Trials Register, Medline, Embase) • Reference lists • Handsearching • English language/non-English language • Sources of ongoing and/or unpublished studies
Reporting biases • Statistically significant ‘positive’ results are; • more likely to be published • publication bias • more likely to be published rapidly • time lag bias • more likely to be published in English • language bias • more likely to be cited by others • citation bias
Unbiased selection and data abstraction process • Selection of relevant papers
Unbiased selection and data abstraction process • Selection of relevant papers • Data abstraction/extraction
Data extraction is: • Time consuming • Often subjective • Prone to error • Often difficult
Unbiased selection and abstraction process • Predefined data abstraction form • Independently and in duplicate
4. Validity assessment • Can be used; • As a threshold for inclusion of studies • As a possible explanation for differences in results between trials • In sensitivity analyses • As weights in statistical analysis of the results
Quality assessment tools • Composite scales - assign numerical value to individual items to provide overall estimate of quality – problematic • Component approach - assesses relevant methodological aspects individually (e.g randomisation, blinding, drop-outs) - preferred
4. Validity assessment • Process should be conducted independently by at least two reviewers • Results of the quality assessment should be reflected in the analysis
Study synthesis • Appropriate pooling • qualitative (narrative) • quantitative (meta-analysis) • inappropriate when data are sparse or heterogeneity exists • Clear presentation of individual studies included in the review
Meta-analysis • The process of using statistical methods to combine the results of different studies. • The aim is to integrate the findings, pool the data, and identify the overall trend of results (Dictionary of Epidemiology, 1995)
What is a meta-analysis? Optional part of a systematic review Systematic reviews Meta-analyses
When can/should you do a meta-analysis? • When more than one study has estimated an effect • When there are no differences in the study characteristics that are likely to substantially affect outcome • When the outcome has been measured in similar ways • When the data are available (beware when only some data are available)
Summary statistic for each study • Calculate a single summary statistic to represent the effect found in each study - usually displayed with 95% confidence intervals (CI)
Weighting studies • More weight to the studies which give us more information • More participants • More events • Lower variance • Weight is proportional to inverse variance
Displaying results graphically • Forest plots • Commonly used
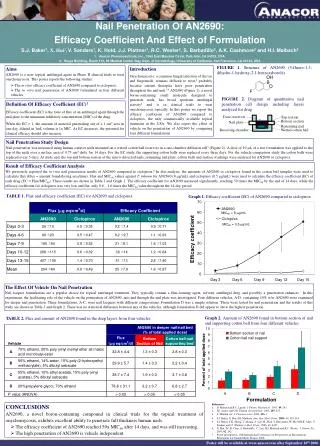
there’s a label to tell you what the comparison is and what the outcome of interest is Alderson 2002
At the bottom there’s a horizontal line. This is the scale measuring the treatment effect. Here the outcome is death and towards the left the scale is less than one, meaning the treatment has made death less likely. Take care to read what the labels say – things to the left do not always mean the treatment is better than the control. Alderson 2002
The vertical line in the middle is where the treatment and control have the same effect – there is no difference between the two Alderson 2002
The data for each trial are here, divided into the experimental and control groups This is the % weight given to this study in the pooled analysis For each study there is an id Alderson 2002
The data shown in the graph are also given numerically The label above the graph tells you what statistic has been used • Each study is given a blob, placed where the data measure the effect. • The size of the blob is proportional to the % weight • The horizontal line is called a confidence interval and is a measure of • how we think the result of this study might vary with the play of chance. • The wider the horizontal line is, the less confident we are of the observed effect. Alderson 2002
The pooled analysis is given a diamond shape where the widest bit in the middle is located at the calculated best guess (point estimate), and the horizontal width is the confidence interval Note on interpretation If the confidence interval crosses the line of no effect, this is equivalent to saying that we have found no statistically significant difference in the effects of the two interventions Alderson 2002
Heterogeneity • Clinical heterogeneity – differences in trial characteristics • Statistical heterogeneity - the variability in the reported effect sizes between studies • how similar are the results? • are the differences among the results of the trials greater than could be expected by chance alone?
Heterogeneity • Chi-squared test of heterogeneity • P<0.1 demonstrates statistically significant heterogeneity • may not be appropriate to pool data
Subgroup analyses • Where it is suspected in advance that certain features may alter the effect of an intervention Example • women • a particular age group • those with a specific disease subtype
Subgroup analysis • Often misleading- • Is there indirect evidence in support of a difference? • Did the hypothesis about the difference precede rather than follow the analysis? • Is the subgroup analysis one of a small number of hypotheses tested?
Sensitivity analysis • Does result change according to small variations in the data and methods? • Choice of treatment effects or method for pooling • Inclusion/exclusion of dubious data • Inclusion/exclusion of trials
A common sensitivity analysis is to repeat the analysis taking out lower quality trials
Useful websites; http://www.shef.ac.uk/~scharr/ir/netting/ (comprehensive list of E.B.P. websites and links) http://www.york.ac.uk/inst/crd • CRD manual on how to conduct a systematic review • DARE - database of abstracts of reviews of effectiveness http://www.cochrane.org • reviewer’s handbook • Cochrane Library (abstracts only)
Cochrane Oral Health Group – looking to the futureEmma TavenderCochrane EPOC Satellite, Melbourne Australia
Aims • Progress of the group • Process of undertaking a systematic review with the group & support available • Challenges for the future • Questions & answers
Cochrane Oral Health Group Include all RCTs of oral health broadly conceived to include the prevention, treatment and rehabilitation of oral, dental and craniofacial diseases and disorders Achievements • 624 members from 40 countries • Panel of referees • Set up Specialised Register of Trials (21,000) • Handsearching programme • Annual Evidence Based Dental Practice Course • NIDCR funding for oral cancer reviews
Oral Health Group Reviews 68 Protocols 54 Reviews 21 Updates
Growth of Oral Health Group Trials RegisterJanuary 1998 – January 2006
Editorial Process • Register title • Prepare protocol • Editorial and external review of protocol • Protocol entered on Cochrane Library • Identify trials • Complete systematic review • Peer review of systematic review • Systematic review entered on Library • Update the review regularly (every 2 years)