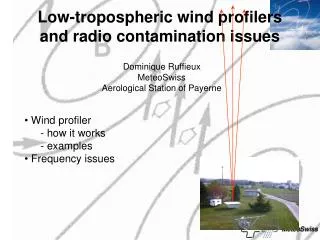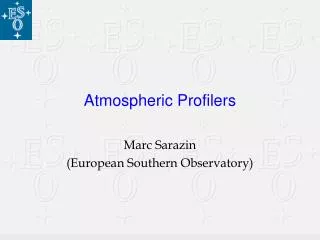
Profilers
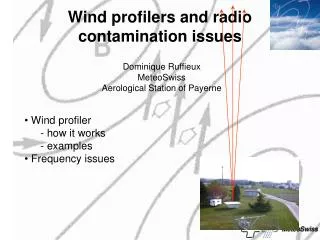
Profilers. Wind profilers are phased array radars that measure the wind as a function of height above a fixed location. Characteristics: Wavelength: 33 cm to 6 m Frequency: 50 MHz to 900 MHz Scattering elements: Variations in air moisture/density

Profilers
E N D
Presentation Transcript
Wind profilers are phased array radars that measure the wind as a function of height above a fixed location. Characteristics: Wavelength: 33 cm to 6 m Frequency: 50 MHz to 900 MHz Scattering elements: Variations in air moisture/density (best in moist turbulent air with no or uniform precip) (worst in dry stable air or variable precip) Wind detection: Doppler shift of frequency by moving scatterers
1920s-70s Profilers were used for ionospheric research Late 70s: First 50 MHz profiler tested for tropospheric research Mid 80s: Small network of 5 profilers deployed in Colorado 1990-92: Demonstration network of profilers (blue) deployed in central US. Late 90s- Networks of profilers deployed by other agencies
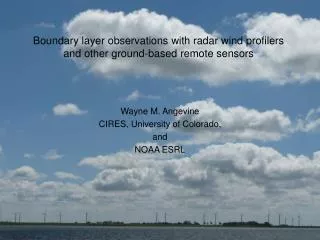
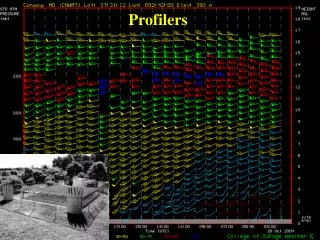
Display of profiler data: A wind profile is generated every 6 minutes from the NOAA network. Data is often plotted every hour as below, But is available every six minutes (see COD site for best display) (http://weather.cod.edu/analysis/analysis.profiler.html) Cold frontal passage marked by wind shift Time reversed: Allows data to appear as it would in space for steady state passage of features
Hourly wind profiles from Winchester, IL profiler Color denotes speed Jetstream Note boundary
Six minute wind profiles from Palestine, TX profiler Note poor wind recovery
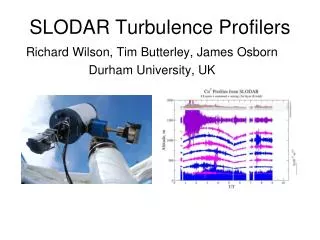
A profiler with a radio acoustic sounding system (RASS) Phased array radar Equipment cabinet RASS Close-up views
Upper array East Beam Wavelength determined by array spacing Lower array North Beam Vertical Beam Each element of array transmits an electromagnetic pulse
The direction of the beam is determined by the lag between the tranmission time for the elements of the array Vertical beam 75 degree beam All elements transmit simultaneously Longer cable length leads to lag in transmission time across the array
Nyquist velocity = 22.5 m/s Longer pulses Different PRF Nyquist velocity = 15 m/s Radial velocity (not horizontal wind velocity!)
Radio Acoustic Sounding System Horn that chirps Antenna focuses Sound chirp so that It propagates vertically
RASS - Calculation of virtual temperature • The RASS unit sends out an acoustic (sound) wave in the vertical direction. • The propagation speed of the acoustic wave depends on the temperature and moisture composition of the atmosphere. The speed of the acoustic wave is related to the virtual temperature by Ca = 20.047(Tv1/2) • The profiler then sends out it's own pulses which backscatter off of the RASS acoustic wave. It measures the Doppler shifted frequency of the acoustic wave (speed of sound), thus one can obtain Ca from the Doppler shifted frequency. This is very similar to determining the radial velocity of precipitation targets with an 88-D by measuring the Doppler shifted frequency of the backscattered energy. • Once Ca is known, then Tv = (Ca/20.047)2 . • The RASS measurements of the vertical profile of Tv are generally reported every hour, though it only takes a few minutes to obtain the measurements.
RASS data is generally only reliable in the boundary layer Example of RASS virtual temperature retrieval RASS data http://www.profiler.noaa.gov/jsp/profiler.jsp
Profilers have sidelobes similar to traditional radars -- the intensity of the sidelobes related to the size of the array
Profilers measure winds in clear air The mechanism of scattering, Bragg scattering, depends on diffraction of electromagnetic waves caused by perturbations in the refractive index on a scale of half the wavelength of the radar Diffraction pattern caused by single object Coherent wave reflection caused by objects spaced at half the wavelength of impinging wave Water wave
What causes variations in the refractive index at small scales? Primarily variations in moisture (mixing ratio) Do profilers sense precipitation (Rayleigh scattering)? YES!
Profiler equations: Clear air retrieval of winds Measured radial velocity Solve for u and v components and winds
Problem: When precipitation is occurring, vertical beam senses motion of precipitation (W = w + vt)
Consider two situations 1: rain falling uniformly in all beams
Consider two situations 2: rain falling only in tilted beamd
Non-uniform rain contaminates wind recovery with profilers No rain Rain in all beams Rain in two slant beams
NOAA profilers use a 128-point fast-Fourier transform (FFT) to perform spectral analysis and determine velocity estimates. Doppler spectrum Doppler spectrum with noise floor removed and moments of spectrum (radial velocity and spectral width) estimated.
NOAA profilers are 404 MHz, the same frequency used by the SARSAT satellite that looks for signals from the “black box” of aircraft that have crash landed. The profilers are required to shut down when the satellite can sense signals within an inhibit cone, as shown below
Each profiler is oriented differently so that the beams minimally interfere with satellite – net result: NONE of the beams point north or east – if you use the raw data you must be aware of this and adjust your winds accordingly!!!
NOAA display with RASS http://www.profiler.noaa.gov/jsp/profiler.jsp
RAP/NCAR profiler display http://www.rap.ucar.edu/weather/upper/
College of DuPage Profiler Display http://weather.cod.edu/analysis/analysis.profiler.html