Debuggers, Analysis Tools and Profilers
Debuggers, Analysis Tools and Profilers. Aaron Bloomfield CS 415 Fall 2005. “A software tool that is used to detect the source of program or script errors, by performing step-by-step execution of application code and viewing the content of code variables.” -MSDN. What is a Debugger?.

Debuggers, Analysis Tools and Profilers
E N D
Presentation Transcript
Debuggers, Analysis Tools and Profilers Aaron Bloomfield CS 415 Fall 2005
“A software tool that is used to detect the source of program or script errors, by performing step-by-step execution of application code and viewing the content of code variables.” -MSDN What is a Debugger?
What is a Debugger? (con't) • A debugger is not an IDE • Though the two can be integrated, they are separate entities. • A debugger loads in a program (compiled executable, or interpreted source code) and allows the user to trace through the execution. • Debuggers typically can do disassembly, stack traces, expression watches, and more.
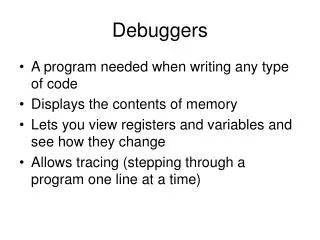
Other Forms of Debugging • Periodic printf/cout/print/write/etc. • Statements with relevant information • Assert statements • Desk Checking NOTE: this is errors found in programs that are correct according to the syntax and grammar of the language.
Why use a Debugger? • No need for precognition of what the error might be. • Flexible • Allows for “live” error checking – no need to re-write and re-compile when you realize a certain type of error may be occuring • Dynamic • Can view the entire relevant scope
Why people don’t use a Debugger? • With simple errors, may not want to bother with starting up the debugger environment. • Obvious error • Simple to check using prints/asserts • Hard-to-use debugger environment • Error occurs in optimized code • Changes execution of program (error doesn’t occur while running debugger)
Types of Debuggers • Two types of debuggers (really, two types of languages) • Interpreted language debuggers • Compiled language debuggers • Which do you think is easier to write?
Debuggers for Compiled Languages • Harder to implement • Generally, would like information about source code (not normally included in compiled executables) • Work on a lower level • Need special “debug” executables. • More complex, and we'll focus on these.
Functions of a Debugger • Disassembly • Execution Tracing/Stack tracing • Symbol watches
Disassembly • Most basic form of debugging • Translating machine code into assembly instructions that are more easily understood by the user. • Typically implementable as a simple lookup table • No higher-level information (variable names, etc.) • Relatively easy to implement.
Execution Tracing • Follows the program through the execution. Users can step through line-by-line, or use breakpoints. • Typically allows for “watches” on – registers, memory locations, symbols • Allows for tracing up the stack of runtime errors (back traces) • Allows user to trace the causes of unexpected behavior and fix them
Symbol Information • Problem – a compiler/assembler translates variable names and other symbols into internally consistent memory addresses • How does a debugger know which location is denoted by a particular symbol? • We need a “debug” executable.
Debug vs. Release Builds • Debug builds usually are not optimized • Debug executables contain: • program's symbol tables • location of the source file • line number tags for assembly instuctions.
What are they? How many people have used these? Time Profilers: • Tells you where your program spent its time • Tells you which functions called which other functions while it was executing
What are they? Space Profiler: • Also called “heap profiling” or “memory profiling” • Space profiling is useful to help you reduce the amount of memory your program uses.
How do they work? Time profiler: • Profiling works by changing how every function in your program is compiled so that when it is called, it will stash away some information about where it was called from. • From this, the profiler can figure out what function called it, and can count how many times it was called
How do they work? (2) Space Profiler: • Stops execution and examines the stack • Stops execution when a page of memory is allocated • Collects Data about which function asked for the memory
How do they work? (3) • After the data is collected by the profiler, an interpreter must be run to display the data in an understandable format • Can be text-based or graphical
Why do I need a time profiler? • Find where the program is spending most of it’s time • That’s where you should focus optimization efforts • The program performs the proper functions, but is too slow • Important in real time systems • Important to web applications • The program is too large or too complex to analyze by reading the source
Why do I need a space profiler? • The program needs to use a fixed amount of memory • The program is too large to conceive of the overall memory usage or how often memory requests are made • Profilers can show the memory usage of libraries used by your program
Some Profiler Examples – Time • gprof – GNU Profiler • compile programs with the –pg option • execute program to generate data • run gprof to interpret the data
gprof sample data – Flat Profile Each sample counts as 0.01 seconds. % cumulative self self total time seconds seconds calls ms/call ms/call name 33.34 0.02 0.02 7208 0.00 0.00 open 16.67 0.03 0.01 244 0.04 0.12 offtime 16.67 0.04 0.01 8 1.25 1.25 memccpy 16.67 0.05 0.01 7 1.43 1.43 write 16.67 0.06 0.01 mcount 0.00 0.06 0.00 236 0.00 0.00 tzset 0.00 0.06 0.00 192 0.00 0.00 tolower
gprof sample data – Call graph index % time self children called name ----------------------------------------------- 0.00 0.05 1/1 main [2] [3] 100.0 0.00 0.05 1 report [3] 0.00 0.03 8/8 timelocal [6] 0.00 0.01 1/1 print [9] 0.00 0.01 9/9 fgets [12] 0.00 0.00 12/34 strncmp <cycle 1> [40] 0.00 0.00 8/8 lookup [20] 0.00 0.00 1/1 fopen [21] 0.00 0.00 8/8 chewtime [24] 0.00 0.00 8/16 skipspace [44] -----------------------------------------------
Some Profiler Examples – Space • Massif • Space Profiler for C and C++ • Provides relative space data on 5 different areas: • Heap blocks • Heap administration blocks • Stack sizes • Code size • Data size
Massif sample data - basic ==1012== Total spacetime: 917,098,589 ms.B ==1012== heap: 0.0% ==1012== heap admin: 0.0% ==1012== stack(s): 0.0% ==1012== static code: 44.4% ==1012== static data: 55.3%
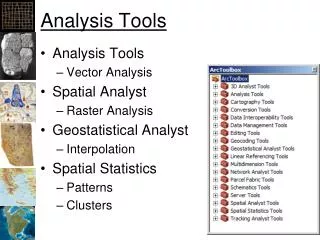
Purpose of Analysis Tools • Need for a feasible method to catch bugs in large projects. Formal verification techniques require unreasonable effort on large projects. • Augment traditional debugging techniques without adding unreasonable burden to the development process.
Two Types of Analysis Tools • Static Analysis • Run-time (dynamic) Analysis
Static Analysis • Examine a program for bugs without running the program. • Examples: • Splint (www.splint.org), • PolySpace C Verifier (www.polyspace.com).
Splint • Open Source Static Analysis Tool developed at U.Va by Professor Dave Evans. • Based on Lint.
Errors Splint will detect • Dereferencing a possibly null pointer. • Using possibly undefined storage or returning storage that is not properly defined. • Type mismatches, with greater precision and flexibility than provided by C compilers. • Violations of information hiding. • Memory management errors including uses of dangling references and memory leaks. • Dangerous aliasing.
Errors Splint will detect continued… • Modifications and global variable uses that are inconsistent with specified interfaces. • Problematic control flow such as likely infinite loops. • Buffer overflow vulnerabilities. • Dangerous macro initializations and invocations. • Violations of customized naming conventions.
What’s wrong with this code? void strcpy(char* str1, char* str2) { while (str2 != 0) { *str1 = *str2; str1++; str2++; } str1 = 0; //null terminate the string }
What happens to the stack? void foo() { char buff1[20]; char buff2[40]; … //put some data into buff2 strcpy(buff1, buff2); }
Secure Programming • Exploitable bugs such as buffer overflows in software are the most costly bugs. • Incredibly frequent because they are so hard to catch. • Analysis tools play a big part in finding and fixing security holes in software.
How does Splint deal with false positives? • Splint supports annotations to the code that document assumptions the programmer makes about a given piece of code • These annotations help limit false positives.
Run-time Analysis • Many bugs cannot be determined at compile time. Run-time tools required to find these bugs. • Run-time analysis tools work at run-time instead of compile time. • Example – Purify (www.rational.com).
Purify • Purify modifies object files at link time. • After execution, Purify will report bugs such as memory leaks and null dereferences.
Purify continued… • From the purify manual: “Purify checks every memory access operation, pinpointing where errors occur and providing diagnostic information to help you analyze why the errors occur.”
Types of errors found by Purify • Reading or writing beyond the bounds of an array. • Using un-initialized memory. • Reading or writing freed memory. • Reading or writing beyond the stack pointer. • Reading or writing through null pointers. • Leaking memory and file descriptors. • Using a pointer whose memory location was just deallocated
Static vs. Run-time Analysis • Probably good to use both. • Run-time analysis has fewer false positives, but usually requires that a test harness test all possible control flow paths.
Cons of Analysis Tools • Add time and effort to the development process. • Lots of false positives. • No guarantee of catching every bug. • However, in a commercial situation, probably worth your time to use these tools.