Download
1 / 24
901 likes | 2.91k Vues
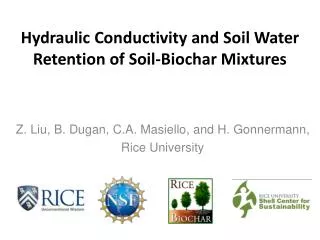
Soil water retention curve. Soil water retention curve. The relationship between soil matric potential and soil water content “matric suction” = - soil matric potential Usually soil volumetric water content is used Usually determined based on empirical data Sometimes called by other names

E N D
Soil water retention curve • The relationship between soil matric potential and soil water content • “matric suction” = - soil matric potential • Usually soil volumetric water content is used • Usually determined based on empirical data • Sometimes called by other names • Soil moisture characteristic curve • Soil moisture release curve • Etc... • When m = 0, the soil is saturated
Air-entry suction, e • the critical value at which the largest surface pore begins to empty • Coarse textured or well-aggregated soils • Small e • Sharp changes in water content near e • Fine textured or poorly-aggregated soils • Larger e • Gradual changes in water content near e
Chan, T.P., and R.S. Govindaraju. 2004. Estimating soil water retention curve from particle-size distribution data based on polydisperse sphere systems. Vadose Zone J. 3:1443-1454. The measured and estimated soil water retention curves of Troup loamy sand (code no. 1012) (a) with fitted α and (b) with theoretical α. The fitted α value is higher than the theoretical one. TIS, totally impenetrable spheres model; FPS, fully penetrable spheres model; and VG, van Genuchten model
Reading assignment • Soil water retention • p. 116-123 • Hysteresis and Measurement of Soil-Moisture Potential
Hysteresis • Desorption curve: an initially wet soil is dried by applying increasing amounts of suction. • Sorption curve: an initially dry soil is gradually wetted by reducing the suction. • Hysteresis is the phenomenon when the desorption and sorption curves differ. • From the Greek husterēsis, a shortcoming, • from husterein, to be late • for a given matric suction during sorption “comes short” of during desorption
Causes of hysteresis • Nonuniform shape of individual pores: “ink bottle” effect
Causes of hysteresis • Contact angle hysteresis: contact angle is greater during wetting
Causes of hysteresis • Entrapped air • Changes in soil structure: shrink-swell, etc…
Factors influencing soil water retention • Soil structure (b, aggregate size distribution) • important at low suctions, 0 to 50 kPa *Note: 1 kPa = 10.2 cm H2O at 4C • Capillary effects
Stange, C.F., and R. Horn. 2005. Modeling the soil water retention curve for conditions of variable porosity. Vadose Zone J. 4:602-613. • Insert 6.9 Comparison of measured and fitted water retention curves for homogenized soil samples from the StagnicChernozem Ah horizon (Hildesheim site) involving five different reference void ratios between 0.98 and 1.63 at saturation.
Factors influencing soil water retention • Soil structure (b, aggregate size distribution) • important at low suctions, 0 to 50 kPa • Capillary effects • Clay content • Positively related to surface area of soil particles • Positively related to water adsorption • Dominant factors at high suctions
Factors influencing soil water retention • Soil structure (b, aggregate size distribution) • important at low suctions, 0 to 50 kPa • Capillary effects • Clay content • Positively related to surface area of soil particles • Positively related to water adsorption • Dominant factors at high suctions • Soil organic matter • Reduces b • Increases water retention at low suctions
Models of soil water retention • Brooks and Corey (1966) • r = residual volumetric water content (at high suction) • s = saturated volumetric water content • e = air entry suction • = pore size distribution index
Models of soil water retention • Van Genuchten (1980) (cited >3000 times) • = fitting parameter inversely related to e • n = fitting parameter which affects the shape of the curve • m = fitting parameter often fixed as m = 1 – 1/n
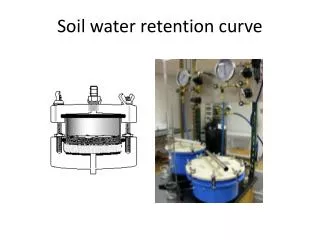
Measuring soil water retention curves • Hanging water column • Tempe cells • Pressure plates http://web.ku.edu/~soil/Facilities_files/IMG_0141.jpg http://www.ictinternational.com.au/images/extractor1400-2.gif
Monitoring soil matric potential: heat dissipation sensor • Campbell Scientific, Inc. 229 Heat dissipation sensor
Estimating soil water content using the Mesonet’s CSI 229 sensors • Step 1: convert sensor reading to matric potential
Estimating soil water content using the Mesonet’s CSI 229 sensors • Step 2: convert matric potential to soil volumetric water content using van Genuchten’s equation • = fitting parameter inversely related to e • n = fitting parameter which affects the shape of the curve • m = fitting parameter often fixed as m = 1 – 1/n
Reading assignment • Laminar Flow and Darcy’s Law, p. 127-136 • Homework 3 due Wednesday, Oct. 10