Download
1 / 14
170 likes | 431 Vues
Hydraulic Conductivity and Soil Water Retention of Soil-Biochar Mixtures. Z. Liu, B. Dugan, C.A. Masiello, and H. Gonnermann, Rice University. Motivation. CO 2 -driven acceleration of hydrologic cycle will result in both increasing drought and more intense precipitation events;

E N D
Hydraulic Conductivity and Soil Water Retention of Soil-Biochar Mixtures Z. Liu, B. Dugan, C.A. Masiello, and H. Gonnermann, Rice University
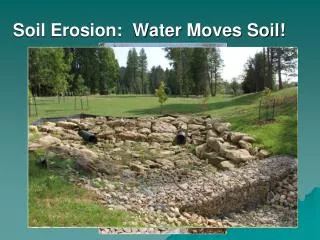
Motivation • CO2-driven acceleration of hydrologic cycle will result in both increasing drought and more intense precipitation events; • Biochar may improve crop productivity by: • Reducing speed of infiltration, holding water on the landscape longer; • Increasing plant available water. • GOAL: test the effect of biochar on these properties and determine controlling mechanisms in sandy soils.
Key Points: Adding Biochar to Sand • Adding up to 6 wt% biochar can decrease hydraulic conductivity (K) by up to 78%; • Adding up to 10 wt% biochar can increase field capacity (from 3-12%), permanent wilting point (from 2-8%) and plant available water (from 1-4%); • Biochar grain size alters K; however, neither biochar grain size nor pyrolysis temperature have a large effect on plant available water.
4 cm Column Water 25 cm h Sand+biochar Mesh Leachate K and Soil Water Retention Methods ω Sand+biochar Filter tube r Nylon Filter r1 Reservoir tube Water L ψ=ρω2 (r2-r12)/2g
Biochar Particles Smaller than Sand Decrease K at 6 wt% amendment
Potential Mechanisms r Grain size effect: pore throat size and tortuosity L r + L r + K is mainly controlled by pore space between biochar and sand. L
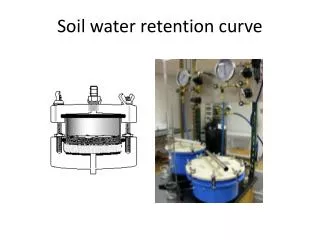
Soil Water Retention Curves More Biochar, Higher Water Content
More Biochar, Higher Plant Available Water 11.8 ± 0.9% 8.1 ± 0.9% 2.9 ± 0.4% 4 ± 1% 1.7 ± 0.4% 1.2 ± 0.5% Field capacity, permanent wilting point and plant available water content increase with biochar amendment rate.
Pyrolysis T and Biochar Grain Size Have NO effect on Available Water Content at 6 wt% Most of water in biochar-amended sand is not available to plants.
Conclusions • Adding up to 6 wt% biochar can decrease hydraulic conductivity by up to 78%; • Biochar particles smaller than sand decrease K; • Adding up to 10 wt% biochar can increase field capacity (from 2.9 ± 0.4% to 11.8 ± 0.9%), permanent wilting point (from 1.7 ± 0.4% to 8.1 ± 0.9%) and plant available water (1.2 ± 0.5% to 4 ± 1%); • Biochar grain size and pyrolysis temperature do not have large effect on plant available water content; • Most of water in biochar-amended sand is not available to plants.
Extended Van Genuchten Model Where ψc is solved by: Zhang, Z. F., 2011