Download
1 / 46
460 likes | 618 Vues
The USDA Biofuels Strategic Production Report . A Regional Roadmap to Meeting the Biofuels Goals of the Renewable Fuels Standard by 2022. President Obama’s Commitment to Renewable Energy:

E N D
The USDA Biofuels Strategic Production Report A Regional Roadmap to Meeting the Biofuels Goals of the Renewable Fuels Standard by 2022
President Obama’s Commitment to Renewable Energy: “To put people back to work today, and reduce our dependence on foreign oil tomorrow, we will double renewable energy production.”
“USDA is working to expand energy opportunities by producing alternative forms of energy and fuel, and to ensure that we are doing the research necessary to allow agriculture to transition away from its rather significant dependence on fossil fuels.” Tom Vilsack Agriculture Secretary
Biofuels Interagency Working Group On May 5, 2009, President Obama signed the directive establishing a new working group to be chaired by the Secretaries of Energy and Agriculture and the Administrator of the Environmental Protection Agency. The group will work with the National Biomass Research and Development Board on: • Creating a biofuel market development program to boostnext-generation biofuels, increase use of flex-fuel vehicles,and assist retail market development • Coordinating infrastructure policies
Introduction As part of this effort, USDA is developing a comprehensive strategy to help recharge the rural American economy through the development of a successful biofuels market. The market must be capable of achieving the U.S. Renewable Fuels Standards (RSF2), as set out in the Energy Independence and Security Act of 2007 (EISA). The RSF2 became effective on July 1st, 2010, and will create new market opportunities for American agriculture to help fulfill it’s mandate: the American economy will be using 36 billion gallons (bg) of renewable transportation fuel per year in its transportation fuel supply by 2022.
An interim copy of this plan was conceptualized in a report published by USDA on June 23rd, 2010, and entitled “USDA Biofuels Strategic Production Report: A USDA Regional Roadmap to Meeting the Biofuels Goals of the Renewable Fuels Standard by 2022.” The report provides an assessment of the current U.S. biofuels market and the scope of the investments that are needed to expand the market to meet the RSF2 mandate. Specifically, the report assesses: • Existing eligible feedstock supply and land availability; • Current and potential infrastructure capacity, and; • Current and potential regional consumer demand.
Objectives USDA’s objectives for the report include: • Providing the practical knowledge from the field that can enhance various models for biofuel production; • Identify challenges and opportunities for expanding the biofuels market; • Help develop solutions to this massive undertaking. At this time the report is an interim product subject to revision. USDA hopes that the report spurs discussions and is looking forward to feedback from Congress, states, industry, science, and all concerned citizens and stakeholders.
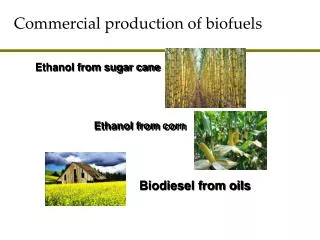
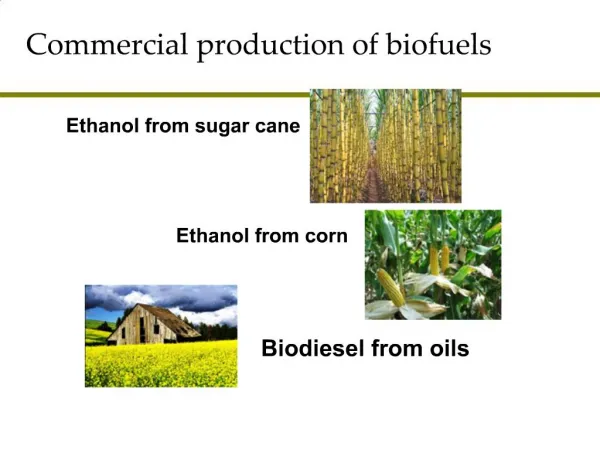
The Role of Corn Starch Ethanol Of the 36 bg of bio-based transportation fuels the RSF2 mandates for use, 15bg can come from conventional biofuel sources such as corn ethanol. Currently, EPA’s analysis projects that this 15 bg could come from current or planned production capacity of corn starch ethanol by 2022. Breakdown of U.S. ethanol production totals: • 10.75 bg produced in 2009; • 12.0 bg projected to be produced in 2010; • 13.5 bg total production capacity of the 201 facilities currently operating; • 1.5 bg additional production capacity from facilities still under construction. The U.S. will soon have the installed capacity to produce up to the 15.0 bg of corn-starch ethanol that is allowed by the RSF2.
Meeting The 21 Billion Gallon Advanced Biofuels Challenge Of the remaining 21 bg needed to achieve the total 36 bg goal: • 16 bg must come from advanced cellulosic biofuels. These are fuels that are made from cellulosic feedstocks that also reduce greenhouse gas emissions by at least 60%. • At least 1 bg are currently required to come from biomass-based diesel. The final contribution level from this source that the RSF2 mandates will be determined at a later date by rule making. The Energy Independence and Security Act also mandates an additional 4bg of advanced biofuels by 2022. This fuel is defined by the reduction of greenhouse gas emissions by at least 50%.
Biodiesel One Billion As with corn starch ethanol, the U.S. biofuels industry is already on track to produce the currently mandated 1 bg of biodiesel by 2022. Current Biodiesel production assessment: • 173 plans active and equal number of companies marketing biodiesel; • 550 mg produced in 2009; • 29 companies with new plants finishing construction in 12-18 months; • 427.8 mg additional production capacity from new plants.
The remaining 20-bg challenge: cellulosic and other advanced biofuels. USDA is working to establish a sustainable biofuels economy to help meet the 20-billion gallons of biofuels challenge. The intention is to expedite the development and deployment of research, development and demonstration projects, facilitate the siting of biorefineries through loan guarantees and other existing programs. Following is an analysis showing one scenario by which the RFS2 targets could be met. It is based on a USDA analysis of regional feedstock availability and other factors.
Feedstock Assumptions and Limitations USDA has developed conservative feedstock production estimates based on dedicated crop feedstocks and waste wood biomass that come from timberland and agricultural lands that are a subset of the RFS2 definitions and assumptions. The estimates do not include all possible feedstock sources that may eventually be eligible to achieve the 21 billion gallons of advanced biofuels as specified by RFS2. Other qualified feedstocks not included in the current analysis, such as tallow or municipal solid waste, could be counted toward meeting the RFS2 mandate.
Feedstock Choice In the RFS2 Final Rule, the EPA identifies a number of feedstock pathways and imports that would satisfy the RFS2 mandates. Feedstock pathways for advanced biofuels include switchgrass, soybean oil, corn oil, crop residues, woody biomass and other feedstocks. The complement of feedstocks included in this USDA analysis and those identified by the EPA should not be considered an exhaustive list of all possible feedstock sources. Additional feedstocks such as biomass (sweet) sorghum, energy cane, and camelina may merit consideration under the RFS2 and for the purposes of this analysis, USDA assumed that these feedstocks were sufficiently similar to those already eligible under the RSF2 and necessary to the regional approach.
Feedstock Definitions EISA provides a specific definition of renewable biomass and places constraints on the types of land from which renewable biomass can be collected or harvested. For the sake of consistency USDA chose to use those definitions in the context of this report.
Feedstock Assumption Summary EPA Expects the following feedstocks and associated number of gallons by 2022: - Switch Grass (perennial grass)………………………………. ………….... 7.9 bg - Soy biodiesel and corn oil……………………………………………………. 1.34 bg - Crop Residues (corn stover, includes bagasse)……………………… 5.5 bg - Woody biomass (forestry residue)……………………………………….. 0.1 bg - Corn Ethanol……………………………………………………………………….. 15.0 bg - Other (municipal solid waster)…………………………………………….. 2.6 bg - Animal fats and yellow grease……………………………………………… 0.38 bg - Algae…………………………………………………………………………………… 0.1 bg - Imports……………………………………………………………………………….. 2.2 bg
Feedstock Assumption Summary USDA estimates the following feedstocks and the associated gallons by 2022: • Dedicated energy crops: Perennial grasses, energy cane, biomass sorghum.…………... 3.4 bg • Oilseeds (soy, canola)………………………………………………………..0.5 bg • Crop Residues (corn stover, straw)……………………………………. 4.3 bg • Woody biomass (logging residues only)……………………………. 2.8 bg • Corn Starch Ethanol………………………………………………………….. 15.9 bg
Land Use Assumptions and Limitations Consistent with EISA, USDA assumes that biomass may be grown on defined agriculture cropland (agriculture cropland where crops are produced and agriculture cropland in pasture). Producing this much in biofuels will take 27 million acres of cropland, 6.5 percent of the total 406.4 million acres of cropland as reported in the 2007 Census of Agriculture (COA). This does not include acreage of timberland harvested from which logging residues are viable feedstocks, nor does it include acreage from traditional food crops from which post harvest crop residues are collected.
Cropland The UDSA’s 2007 COA reports that there is a total of 922.1 million acres of Land in Farms. • 406.4 million acres of agricultural cropland • 515.7 million acres of other land Cropland is further segmented into the following categories: • cropland harvested; • cropland used as pasture; • other crop land idled for conservation or intentional purposes, summer fallow, and failed crops.
Cropland Summary Land in Farms (1,000 Acres):2007 Total land in Farm 922,095 Total Cropland 406,424 Cropland Harvested 309,607 Other Land 515,671 Cropland in Agriculture (1,000 Acres):2007 Cropland Harvested 309,607 Cropland used for pasture 35,771 Cropland cover crop not harvested pasture 37,969 Summer Fallow 15,671 Cropland on which all crops failed 7,405 Cropland idled 0 Total 406,423
Forested Land Estimates of biomass from logging residues are based on actual data from the 2001 – 2005 period, averages assumed to be available per annum. The total and harvested timberland area is also averaged over 2000-2005 period to give an estimate of the area that logging residues actually come from. For the purposes of this analysis 42.5 million dry tons of logging residues is available for fuel production annually. This residue is taken from 10.8 million acres of harvested acreage, as compared to the 507.3 million acres of timberland available for harvesting activities. One dry ton of logging residues is assumed to yield 70 gallons of ethanol per dry ton. In total, about 2.8 billion gallons of advanced biofuels is projected from logging residues.
USDA Regional Analysis Assumption Summary USDA recognized that different regions of the country have a comparative advantage to the type of feedstocks that can be produced and utilized in biofuel production. These regions were determined based upon the prevalence of potential crop and woody biomass feedstocks adapted to diriment ecological regions of the country, their yields, and current producer interest. USDA estimated the following regional contributions to the remaining 21 bg of the RSF2 goal:
Advanced Biofuel Production from New Capacity (billion gallons)
Overcoming Infrastructure Barriers to Converting Biomass Into Biofuels This section provides an assessment of the availability and regional distribution of the resources needed to produce the biofuels to reach the RFS2 target of 36 bg of renewable biofuels per year, an a Assuming an average biorefinery size of 40 million gallons per year, USDA estimates that meeting the RFS2 advanced biofuels goals will mean building 527 biorefineries, at a cost of $168 billion.
Review of Assumptions Costs:USDA assumed a steady cellulosic plant construction cost of $8 per gallon. We recognize that initial construction costs for first of a kind plant will typically be greater than the costs of plants that follow; however, we assume a fixed capital cost over time. Plant construction costs decline in real terms for this analysis. Size: This approach assumes each biorefinery built will have a capacity of 40 million gallons a year. Biofuel Regions: Based on work by the Agricultural Research Service, biofuel feedstock regions were developed based on crops that we expect will be prevalent in those areas based on historic planting data and weather, soil and water conditions.
Review of Assumptions (cont.) Energy Yields per Acre: Through ARS research, we could assume certain energy yields per acre by feedstock and thereby estimate the number of biorefineries necessary for each region to fill their expected biofuels goals. Technology Changes: For the sake of this report, we assume no technology change, which make our estimates conservative. This is a very conservative assumption as RFS2 is predicated on challenging the industry to create newer, cleaner fuels. Also, the agricultural sector as a whole is incredibly productive and has consistently outpaced productivity increases in other sectors, in part, due to its investment in technology (e.g. drought resistant seeds).
Northwestern Region States: Alaska, Idaho, Montana, Oregon, Washington Feedstocks: Woody biomass, oil seed, grasses, cereal crop residue. Other Points of Interest: We have 100 million gallons a year currently being produced in this region from canola, but much of the feedstock is imported from Canada and at this time canola is not an approved feedstock pathway under the RFS2.
Northwestern Region (cont…) Ethanol Biorefineries: Total facilities 4; all producing Biodiesal Refineries: Total 10 facilities—7 producing, 1 idle, 2 in construction
Northwestern Region (cont…) Potential Production Capacity: USDA estimates that 4.6% of advanced biofuel production of the 21 billion gallons required by 2022 (primarily oilseed crops) will be from the Northwest region. This will take an $8.32 billion investment to build 27 biorefineries with an average capacity of 40 million gallons per year. Land Use: Acreage base of 36.9 million acres of cropland and cropland pasture plus 86.4 million acres of forest land. To produce the 1 billion gallons from 2.5 million acres of dedicated bioenergy crops plus 911,500 acres of harvested logging residue in a year it will take 6.9% of the available cropland and cropland pasture acreage base.
Infrastructure Considerations for the Expanded Use of Biofuels
There are a number of potential barriers and bottlenecks in the current ethanol use supply chain. While we expect the market to respond to the infrastructure needs of a growing industry, we recognize that the path from production to actual consumption presents challenges that will need to be anticipated and addressed. Examples of infrastructure barriers that must be addressed to meet the RSF2 mandate include: • The U.S. vehicle fleet is currently unable to accept ethanol blends above 10%; • Flex Fuel Vehicles capable of utilizing E85 are very limited; • Ethanol distribution is limited by the dependence on rail for transportation, which prevents ease of access to blending terminals, and; • The necessary installation of blender pumps for expanded retail sale.
Blender Pumps While the market will determine the ultimate need for blender pumps, this is one area that USDA can immediately offer assistance on infrastructure. The number of FFV vehicles in service and locations of concentrations of these vehicles is a good indicator of current blender pump needs. Flex Fuel Vehicles (FFVs) on the road: 8.0-8.5 million Percent of total U.S. vehicle fleet: 3.2 – 3.5 %
Concentration of Flex Fuel Vehicles The map below shows the distribution of FFVs by county (NREL), indicating the concentration of FFVs is mainly near the ethanol-producing region.
Concentration of Flex Fuel Vehicles The bulk of the FFVs are located in the Midwest. Below are the number of counties in other states with a concentration of FFVs in the 5 – 10 percent range: On a land density basis (FFV/5 sq. miles), the FFVs are concentrated in the East and West Cornbelt and the Southern and Northern Plains states. There is an opportunity to increase the number of FFVs in the West Coast markets such as, California, Arizona, Washington, and Oregon and in the Northeast states, because currently their share in those major markets is low. The top five states in terms of FFVs are Texas, Florida, California, Michigan and Ohio and they account for one-third of the FFVs (July 1, 2009). One point of information—due to the total number of vehicles in the urban areas of California and Michigan—they are boosted into the top five states in terms of FFVs.
Ethanol Consumption by State The map below shows that California, Texas and Florida are the States with the highest consumption of ethanol and may be the primary targets for blender pumps and flex-fuel vehicles.
Blender Pump Costs According to the EPA, CFDC, RFA and NREL there is a wide range in the estimated cost to install blender pumps. The range in costs is directly attributed to whether existing pumps can be modified or need to be replaced and whether Underground Storage Tanks (UST) need to be put in or modified.
Blender Pump Costs According to the EPA, CFDC, RFA and NREL there is a wide range in the estimated cost to install blender pumps. The range in costs is directly attributed to whether existing pumps can be modified or need to be replaced and whether Underground Storage Tanks (UST) need to be put in or modified. The cost for a standard fuel dispenser: $14,000 For an E85 dispenser $23,000 Total Cost of Modifying Standard Pump: $11,775 Dispenser Hose Replacement: $750 Wetted Fuel Dispenser Component replacements: $10,000 Installation Costs: $1,025
Blender Pump Costs Average Cost of Installing new tank and E85 Dispensing Equipment: $122,000 Additional Costs for breaking ground to modify or add pipes, tanks: $25,000 Multiple pump installations at one facility would spread the underground work cost across more pumps. An NREL 2008 survey of 120 stations found that the median cost to add a new tank was $59,000.
Blender Pump Costs The cost to install blender pumps can vary widely, which means that the support necessary for this process must be flexible. In addition to federal support, some states provide support to offset some of the installation costs to the fueling stations in installing blender pumps. A number of states have incentives designed to stimulate consumption of biofuels, but a state by state listing is not possible at this time. USDA is in the process of compiling this list, with the help of the states. The incentives could include: industry recruitment incentives, corporate tax credits, net metering policies, grants, loan programs, rebate programs, personal tax credits, sales tax exemptions, property tax exemptions, and production incentives. However, more than half of the states provide some E85 production and/or sale encouragement.
Rail and Trucking Infrastructure Current conditions for ethanol distribution should guide us in evaluating potential gaps in infrastructure needs as biofuels supply increases and demand responds as it becomes more widely available and competitive with other fuels. Ethanol consumption has followed a gradual regional development. Most of ethanol is distributed by rail, but only about 15 percent of petroleum blending terminals that handle ethanol have rail access—most are serviced by pipelines for petroleum products and trucks for ethanol.
Rail and Trucking Infrastructure The map below shows the current patterns of ethanol distribution. It shows the concentration of rail corridors from the producing area in the Midwest to the consumption areas along the coasts.
Rail and Trucking Infrastructure Based on a model developed by Oakridge National Laboratories, EPA projects that 40 unit train rail receipt facilities will be needed to distribute additional volumes of ethanol as targeted by the RFS2. Additional unit-train destinations would likely create more ethanol corridors on the rail network, possibly alleviating congestion points that could develop with increased biofuel shipments. In addition to unit trains, EPA expects manifest rail cars (shipments of less than 80–100 railcar unit trains) will continue to be used to ship ethanol and cellulosic biofuels. EPA estimates the capital costs for the ethanol distribution infrastructure would total $12.066 billion. When amortized, this translates to 6.9 cents per gallon of additional costs associated with shipping RFS2-related volumes of ethanol. Developing unit train destinations is a time-consuming process, usually taking 3 to 5 years. The industry has responded to this challenge by developing rail-to-truck transloading facilities for smaller-than-unit train shipments of ethanol.
This report was intended to start compiling real world data that would indicate the size and scope of the investments necessary to achieve 36 billion gallons of renewable biofuels by 2022. USDA has concluded the following in this report: (1) A rapid build-up in production capabilities is needed to meet the RFS2 targets for cellulosic biofuels. (2) The scope of the monetary investment for biorefineries is substantial. (3) It is important to consider both sides of the market – the production/supply side and mandate/consumption side – and how they respond to the RFS2 mandate.
(4) There are current infrastructure needs, in the form of blender pumps and rail and trucking infrastructure which are in varying stages of being addressed by the market, though a careful assessment of barriers to their development is needed. (5) The U.S. farm sector is capable of producing a diverse complement of feedstocks to make the biofuels industry a truly national effort. (6) In addition, a process for identifying bottlenecks and barriers related to locating biorefineries involving the federal government, Congress, states, the industry and interested stakeholders can help facilitate a biorefinery system that is national in scope.