Regression in EXCEL
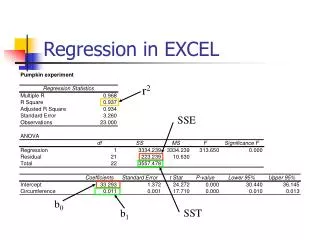
Regression in EXCEL. r 2. SSE. b 0. SST. b 1. Prediction Watch Outs. Consider only the relevant range of the explanatory variable (x) Interpolation is valid Extrapolation is not!!!. Linear Regression in Excel Method 1.

Regression in EXCEL
E N D
Presentation Transcript
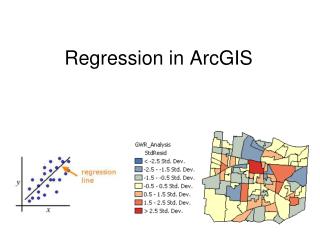
Regression in EXCEL r2 SSE b0 SST b1
Prediction Watch Outs • Consider only the relevant range of the explanatory variable (x) • Interpolation is valid • Extrapolation is not!!!
Linear Regression in ExcelMethod 1 When all you need is the slope and intercept of a best fit line, you can use Excel functions (SLOPE and INTERCEPT) to determine these values. You can also use RSQ to find the coefficient of determination (R2)
Example #1 Using Excel’s Functions to find the slope, intercept, and coefficient of determination
Linear Regression in ExcelMethod 2 Performing a linear regression in Excel is very easy. Once the data have been graphed, regression can be done very simply. Just because it is easy, does not mean that a linear regression always makes sense. Graph the data first and always inspect the “quality” of the fit.
Linear Regression in ExcelMethod 2 When regression is done with the trend line feature of Excel, the fitted curve is automatically added to the graph.
Linear Regression in ExcelMethod 2 The process of performing a linear regression for a slope and intercept requires the computation of various sums using both the independent (x) values and dependant (y) values in the data set being analyzed.
Linear Regression in ExcelMethod 2 • You can calculate the slope b1 and intercept b0 with formula’s, but Excel will do this for you • When trying to find the best fit, always start with a linear fit (unless it is obvious that won’t work), then try exponential and polynomial fits if you think you can get a better fit.
Example #2 Using Excel’s Trendline feature find the equation for a model that fits the data
Linear Regression in ExcelMethod 3 • There is an add-in under tools (regression) that can provide you all the details resulting from a linear regression. • It is easy to use, but interpreting the results requires some understanding of regression terminology
Example #3 Using Excel’s Regression Analysis Tool
Solving Equations You can use Excel to solve a single equation. Like most things in Excel you can do this in many different ways • Graphical solution (find the roots of an equation) • Trial and guess • Excel features…solver and goal seek
Example #1 Using Graphical means to find equation solution
Example #2 Using Goal Seek to find equation solution
Example #3 Using Solver to find solutions