Linear Regression Analysis Using MS Excel
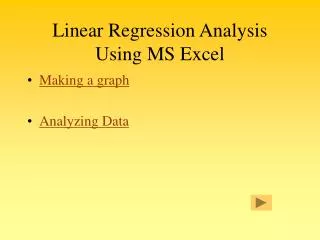
Linear Regression Analysis Using MS Excel. Tutorial for Assignment 2 Civ E 342. The Regression Analysis Procedure. Import Data to Excel. Correlation Analysis. Assume Equation. Prepare Data Table. Regress Using Excel. Quality Analysis. Try More Equ.?. Yes. No. Select the Best Equ.


Linear Regression Analysis Using MS Excel
E N D
Presentation Transcript
Linear Regression AnalysisUsing MS Excel Tutorial for Assignment 2 Civ E 342
The Regression Analysis Procedure Import Data to Excel Correlation Analysis Assume Equation Prepare Data Table Regress Using Excel Quality Analysis Try More Equ.? Yes No Select the Best Equ.
Objective: Import original data to Excel. If it is a text file, open the file in Excel and follow the steps! Label each column - variable names Define (label) independent and dependent variables (x1,x2,...,y) Demo Step 1: Import Data to Excel Import Data to Excel Correlation Analysis Assume Equation Prepare Data Table Regress Using Excel Quality Analysis Try More Equ.? Yes No Select the Best Equ.
Objectives: Important factors? Correlation between factors? Factors with non-linear effect - transform into linear if necessary Method 1: Correlation matrix Excel - “Tools - Data Analysis… - Correlation” Identify the factors that are correlated - high coefficient of correlation Method 2: Scatter diagram Demo Step 2: Correlation Analysis Import Data to Excel Correlation Analysis Assume Equation Prepare Data Table Regress Using Excel Quality Analysis Try More Equ.? Yes No Select the Best Equ.
Objective Identify factors and form of relationship Methods: A trial-and-error process: Stepwise process (not covered in this tutorial) Step 3: Assume a Functional Form Import Data to Excel Correlation Analysis Assume Equation Prepare Data Table Regress Using Excel y = 0+ 1 x1 y = 0+ 1 x1+ 2 x2 Quality Analysis Try More Equ.? Yes No Select the Best Equ.
Objective For the assumed equation: Step 4: Prepare Data Table Import Data to Excel Correlation Analysis y = 0+ 1 x1+ 2 x2 Assume Equation Prepare Data Table Regress Using Excel Quality Analysis Try More Equ.? Yes No Demo Select the Best Equ.
Objective: determine the coefficients that make the equation best fit to the data Method: Method of Least Squares Demo Step 5: Regress Using Excel Import Data to Excel Correlation Analysis Assume Equation Prepare Data Table Regress Using Excel Quality Analysis Try More Equ.? Yes No Select the Best Equ.
Objective: Measures: Coefficient of Determination (R2) t-tests ti>t, n-k-1, -level of significance n-sample size k-no of independent variables Residual plot Intuitive acceptability Demo Step 6: Assess the Adequacy of the Regression Model Import Data to Excel Correlation Analysis Assume Equation Prepare Data Table Regress Using Excel Quality Analysis Try More Equ.? Yes No Select the Best Equ.
Objective: Model Application Models are valid only for the values of the variables within the range of the original data! Step 7: Select the Best Regression Model Import Data to Excel Correlation Analysis y = 0+ 1 x1+ 2 x2 t1 t2 R2 Assume Equation Prepare Data Table Regress Using Excel Quality Analysis Try More Equ.? Yes No Select the Best Equ.