Understanding the Ozone Channel: Characteristics and Applications in Atmospheric Studies
270 likes | 354 Vues
Explore the features and uses of the Ozone channel at 9.7 μm in monitoring ozone concentrations in Earth's atmosphere. Learn about white stripes indicating high ozone levels and their significance in tropospheric height analysis.

Understanding the Ozone Channel: Characteristics and Applications in Atmospheric Studies
E N D
Presentation Transcript
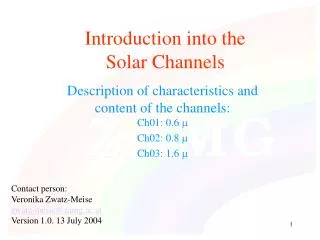
Introduction into the Absorption Channels Description of characteristics and content of the Ozone channel:Ch08: 9.7 Contact person: Veronika Zwatz-Meise zwatz-meise@zamg.ac.at Version 1.0. 13 July 2004
All MSG channels • Channel 01: VIS 0.6 • Channel 02: VIS 0.8 • Channel 03: NIR 1.6 • Channel 04: MIR 3.9 • Channel 05 WV 6.2 • Channel 06: WV 7.3 • Channel 07: IR 8.7 • Channel 08: IR 9.7 („Ozon“) • Channel 09: IR 10.8 • Channel 10: IR 12.0 • Channel 11: IR 13.4 („CO2“) • Chanell 12: HRV (High Resolution Visible)
Ch08: 9.7 Sun radiation Earth radiation Watt/ m2 and micron Ozone Carbon dioxid Water vapour Wavelength (micron)
Comparison of radiation sources sun - earth • For wave length < 5 m solar radiation is dominant • For wave length > 5 m radiation of earth is dominant • Ch01, 02, 03, 12: only sun radiation • Ch04: both: radiation from sun and earth • Ch 05, 06, 07, 08, 09, 10, 11: only thermal earth radiation Sun radiation Earth radiation Watt/ m2 and micron only VIS VIS + IR only IR
Application areas for the Ozone channel • Qualitative application of images: • No well-known additional features compared to the IR window channels • But new feature detected: White stripes • Stripes are „white“ in case of the inverted presentation of the image • They are a measure for high stratospheric Ozone concentrations which have protruded relatively far down into the troposphere • Quantitative applications: • The computation of quantitative Ozone values will be a future task
Ch08 is in the centre of the O3 absorption band around 9 Energy spectrum Source:EUMETSAT Ch08
Signals from lower parts of troposphere; But: Secondary maximum from higher than 100 hPa Weighting functions Source:EUMETSAT Figure 3c
Signals from lower parts of troposphere; But: Secondary maximum from higher than 100 hPa Weighting functions Source:EUMETSAT Figure 3d
Ch08: Ozonechannel, 9.66 • Ozone concentration in the lower stratosphere • is not regarded as a channel with optically applicable structures • But: there are in some situations white stripes in the areas of the black stripes in WV • Further: there are structures in the cloud free sea, best seen in this channel
„White Stripes“ • White stripes can only be seen in Ch08, not in Chs 09, 10 • They appear in areas of dark stripes in WV (Ch05 and 06) • They are accompanied by NWP paramaters typical for low tropopause (tropopause folding): • PV low down (for instance 500 hpa) • Maximum of shear vorticity at 300 hpa • on the cyclonic side of a jet streak • Physical meaning of white stripes: • high content of Ozone which absorbs the radiation from below and emitts radiation according to 2 nd law of Kirchhoff • There are many more situations with low tropopause (tropopause folding) without the white stripe; consequently: • White stripes are an optical indication of high stratospheric Ozone in upper tropopsheric heights
Case 4 December 2002 • Black stripe in WV: Belgium - W-Alps -W-Switzerland - Western Mediterranean • Same area shows white stripe in Ch08 • Model parameters: • PV = 2 unit lower than 400, partly 450 hPa • confluence area at 500 and 300 hPa • maximum of shear vorticity
WV 6.2 MSG: Ch05, WV 04 December 02/ 12.30 UTC
O3 9.7 MSG: Ch08,Ozone 04 December 02/ 12.30 UTC
Maximum of shear vorticity at 300
PV = 2 (tropopause) lower than 450 hPa
Confluence at 500 and 300 hPa
Case 9 July 03/0600 UTC • Black stripe in WV: Atlantic; huge low system • Same area shows white stripe in Ch08 • white stripe not seen in the other IR channels • Model parameters: • close to jet axis (zeroline of shear vorticity) on cyclonic side • maxima of cyclonic shear vorticity • PV = 1 lower than 450 • in vertical cross section convergence at these levels
At cyclonic side of jet streak at 300
Maximum of shear vorticity at 300
PV = 2 (tropopause) lower than 450 hPa