Download
1 / 23
680 likes | 1.49k Vues
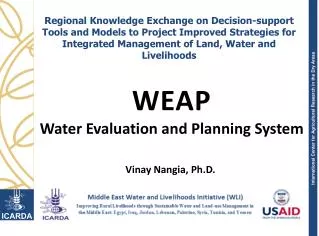
Regional Knowledge Exchange on Decision-support Tools and Models to Project Improved Strategies for Integrated Management of Land, Water and Livelihoods. WEAP Water Evaluation and Planning System. Vinay Nangia, Ph.D. How much river water can a user use?. River flow ≠ Water available to a user

E N D
Regional Knowledge Exchange on Decision-support Tools and Models to Project Improved Strategies for Integrated Management of Land, Water and Livelihoods WEAP Water Evaluation and Planning System Vinay Nangia, Ph.D.
How much river water can a user use? • River flow ≠ Water available to a user • Also reach gains/losses, reservoir storage, consumptive use, return flows, groundwater, soil moisture • Delivery targets and water allocation priorities • Appropriation doctrine (first in time, first in right) • By purpose (e.g.: urban demands before environmental) • By location (e.g.: upstream, then downstream, or reverse) • Prior withdrawals and deliveries • Changes from month to month and year to year
How much river water can a user use? • It’s complicated to track • We’d like a model to do this • WEAP History • First developed in 1992 • WEAP21 version in 2005 • Already 119 published applications (30 in 2012) • Key model development steps • Draw the system schematic • Identify data for system components • Enter data and run the model
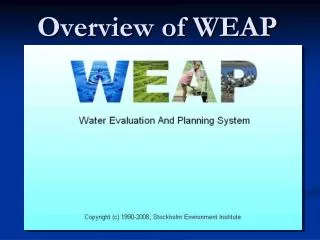
WEAP Highlights Integrated water resources planning system GIS-based, graphical drag & drop interface Basic methodology: physical simulation of water demands and supplies Additional simulation modeling: user-created variables and modeling equations Scenario management capabilities Links to spreadsheets & other models
Modeling process in WEAP Defining the study area and time steps for analysis Creating of the current account Creating of future scenarios Evaluation of results
WEAP system elements Demand sites: A set of users sharing physical distribution system (geographical) Catchments: Points created to account for precipitation, ET, runoff, irrigation and yield from agricultural and non-agricultural fields Reservoirs: Reservoir sites on the river Stream flow gauges: Points where actual flow measurements are acquired, can be compared with simulated values Groundwater nodes: Represents groundwater sources and aquifers Waste water treatment plants
WEAP Capabilities Can do Cannot do High level planning and strategic analysis at local, national and regional scales Demand management Water allocation Daily operations Least-cost optimization of supply and demand
Examples of analyses • Sectoral demand analyses • Water conservation • Water rights and allocation priorities • Groundwater and streamflow simulations • Reservoir operations • Hydropower generation • Pollution tracking • Ecosystem requirements
WEAP for vulnerability… Alternative baseline scenarios can examine vulnerability of water supplies to different demographic, technological, and climatalogical/hydrological futures and adaptability… Alternative policy scenarios can explore demand and supply management options for adapting to future vulnerability Implications for the multiple and competing demands on water systems Implications of policies can be evaluated (ability to meet water needs, hydropower availability, pollution loadings, costs, etc.)
Sectoral water demands Irrigation Ecosystems Livestock Domestic Total Water Demand Mining Commercial Major Cities Industrial
Illustrative Demand Structure SECTOR SUB-SECTOR END-USE DEVICE Furrow Sprinkler Drip Standard Efficient ... Kitchen Bathing Washer Toilet ... Agriculture Industry Municipal Irrigation ... Cooling Processing Others Single Family Multi-family ... Cotton Rice Wheat ... Electric Power Petroleum Paper ... South City West City ...
Demand methods in WEAP Rainfall-runoff catchment method Mass balance “2 bucket” method Root zone soil moisture and below Physically-based (soil, plant, climate, irrigation) Computes crop ET, surface runoff, subsurface lateral seepage, deep percolation to GW, applied irrigation water Suitable for climate change scenarios
Demand methods in WEAP Per capita “unit” water use method Unit rate: Unit water use rate (e.g.: L/person, L/ha, L/home) Total activity level: Total level of activity for the demand category (people, area, homes) Demand volume = Unit rate X Total activity level
Ag demand (Physical parameters) • Soil • Soil moisture holding capacity • Hydraulic conductivity • Initial soil moisture • Plant • Crop coefficient (Kc) • LAI (crop canopy to control surface runoff)
Ag demand (Physical parameters) • Climate • Precipitation • Temperature • RH • Wind speed • Latitude • Melting point temp (snowmelt runoff) • Freezing point temp (snowpack accumulation) • Irrigation • Lower soil moisture threshold (to start irrigation) • Upper soil moisture threshold (to stop irrigation)
Urban demand • Urban indoor (per capita) • Single family • Multi family • Commercial • Industrial • Urban outdoor (catchment) • Single family • Multi family • Commercial • Large landscape
Supplies • Rivers • Groundwater • storage capacity • maximum monthly withdrawal • natural recharge • Diversions (e.g. canals, pipelines) • Reservoirs • Other (e.g. desalination)
Schematic View Click and drag to create a new demand site
Data View Data is displayed numerically and graphically
Results can be displayed in wide range of formats and scales Results View
Availability Evaluation version available at no charge (CDs available here) or download from http://www.weap21.org Full version requires license, available from SEI Training is needed for majority of users System requirements Windows 95 or later 32 MB of RAM (64 MB suggested) Imports from/exports to Excel and Word (not required) Uses standard ArcView GIS shape files. ArcView is not required.