Complex Dynamics of Urban Systems – Some Reflections
220 likes | 399 Vues
Complex Dynamics of Urban Systems – Some Reflections. David Batten. IIASA, IFS, Temaplan Group & CSIRO. David.Batten@csiro.au. Summary. IIASA’s comparative work in the eighties Nested Dynamics of Metropolitan Processes and Policies Cities – planned or self-organizing systems?

Complex Dynamics of Urban Systems – Some Reflections
E N D
Presentation Transcript
Complex Dynamics of Urban Systems – Some Reflections David Batten IIASA, IFS, Temaplan Group & CSIRO David.Batten@csiro.au
Summary • IIASA’s comparative work in the eighties • Nested Dynamics of Metropolitan Processes and Policies • Cities – planned or self-organizing systems? • “Booster” theories of selective urban growth • Large ABMs – e.g. TRANSIMS (Albuquerque), EPISIMS • The new drivers • Global markets – Space versus place, land, water, ecosystems • Climate change – GHG emissions, warming, sea rise • Peak oil – Low emissions transport, new ways of interacting? • Where to next and with what toolkit? • Nonlinear human/climate/ecosystems interface • CSS Working Groups and Interaction Tasks • CABM/HEMA, CDUS, integrated mega-models • Adaptive capacity of Australian cities (Climate Adaptation Flagship) • Fragility of critical infrastructures (with IIASA again)
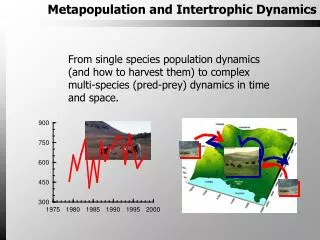
Nested Dynamics of Metropolitan Processes and Policies (IIASA) • Initiated in 1982 • Aims: • To enhance our primitive understanding of interacting metropolitan change processes which are operating at very different speeds (“slow and fast” dynamics) • To develop new concepts and tools that could probe beyond familiar lifecycle theories of urbanization, suburbanization and de-urbanization • Approach: • Systematic comparison of changes and simultaneous interactions between 5 metropolitan subsystems in about 20 major cities: • Population • Housing • Transportation and infrastructure • Economy and workplaces • Institutional management
Key Subsystems and Interactions TYPICAL LINKAGE PARAMETERS SUPPLY SYSTEM (STOCKS) CAPACITY CHANGES INTERMEDIATE DEMAND FINAL DEMAND Changes in housing capacity & location Housing System Dwellings Household size (-) Population Changes in transport capacity & location Transport System Transport Services Vehicle density (+) Changes in production capacity & location Rate of employment (-) Production System Workplaces
Capacity Tensions • Tension signals arise when a state of excess demand or excess supply grows larger, owing to inconsistent directions or speeds of change of the supply and demand components. • e.g. Letting yD denote demand for and xD supply of dwellings at time t, we can formalize the definition of a capacity tension as a state in which: • dxD/dt > dyD/dt when xD> yD or • dxD/dt < dyD/dt when xD< yD • In the eighties, most urban management decisions were seen as necessary responses or adjustments to signals of imbalances and capacity tensions in the urban system. • However, such signals can be misleading if the underlying dynamics are not well understood.
Planned or Self-Organized? • For much of the twentieth century, cities were thought to be the result of premeditated planning alone • Some urban scientists believed that their geographical location and design could even be optimized • Views on urban evolution changed in the 80s and 90s: • “Booster” theories – feedback loops (William Cronon) • Self-organizing human settlements (Peter Allen) • Cities may behave more like human brains • Self-maintaining and self-sustaining • Self-repairing • New set of drivers have emerged
“Booster” Theories of Urban Growth Climate, the natural environment and other attractors Migration and Trade Greater Specialization GROWING CIRCULATION OF GOODS AND PEOPLE (POSITIVE FEEDBACK LOOP) Selective Growth of Settlements Increasing Returns to Scale & Agglomeration
New Drivers of Urban Dynamics? • Global Markets (How and where we produce) • Space versus place? • Resource scarcities – e.g. water, energy (see below) • Land degradation • Threatened ecosystems • Climate Change (How and where we live/consume) • GHG emissions and air pollution • Global warming • Sea rise • Peak Oil (How we interact) • Low emissions transport? • New ways of moving and interacting?
Where Next and What Toolkit? • Human/Climate/Ecosystems Interface • CSIRO-CCSS Working Groups and Interaction Tasks • ABM WG (David Batten) + HEMA network (Pascal Perez) • e.g. NEMSIM, Rangelands model, Barrier Reef model et al • Complex Dynamics of Urban Systems IT • Mega-models – e.g. TRANSIMS, EPISIMS, EPICAST • Integrating social processes in climate & earth system models (John Finnigan) – possibly involving ABM • Adaptive Capacity of Cities • Climate Adaptation Flagship (Liveable cities, coasts & regions) • Audit of adaptive capacity of Australian cities and towns? • Fragility of Critical Infrastructures • IIASA (http://www.iiasa.ac.at/Research/FCI/index.html?sb=8)
Climate Adaptation Flagship • Theme 2: Liveable cities, coasts and regions • Our urban and coastal populations are exposed to climate change through: • declining water availability • increasing extreme weather events • sea level rise. • The four focus areas of this Theme of Flagship research are: • new building and infrastructure design, and adaptation of built infrastructure at building, development and urban system scales • infrastructure planning at larger scales (cities, coastal development) that takes into account policies, codes, regulation, and demands for emergency services • integration of social, economic and environmental analyses to help communities, industry and governments adapt to the impacts of climate change at regional scales • human health and diseases, extreme temperatures and spatial shifts in vector-borne diseases.
Some Useful References • Michael Batty (2005): Cities and Complexity: Understanding Cities with Cellular Automata, Agent-Based Models and Fractals, MIT Press. • Juval Portugali (2000): Self-Organization and the City, Springer Series in Synergetics. • David Batten (2000): Discovering Artificial Economics: How Agents Learn and Economies Evolve, Westview Press. • Pascal Perez and David Batten (2006): Complex Science for a Complex World: Exploring Human Ecosystems with Agents, ANU ePress.
NEMSIM = National Electricity Market Simulator • Goal: To evolve “would-be” worlds of new agents, new micro-grids and new rules • Simulation is changing the frontiers of science • We can explore “What-if” scenarios of really complex systems • Like cities, our National Electricity Market (NEM) is a Complex Adaptive System
Our NEM as a Complex Adaptive System Changes in climate and weather forecasts, contribute to price volatility and demand uncertainty in the NEM Market of Adaptive Agents Climate Scenarios Stationary energy accounts for about 60% of all GHG emissions GHG Emissions Calculator Physical Energy Network Natural System Socio-Technical System
What kind of Simulator is it? Agent-based simulation (or MAS) NEM participants are the software agents Agents’ behaviours programmed via rules Action evolves in 3 simulatedenvironments Collective outcomes (and surprises) emerge from the bottom up. Examples areprice volatility, market power, network congestion, regional blackouts and excessive GHG emissions.
P10 P9 9126.00 P8 6300.00 P7 2200.00 P6 252.00 P5 136.00 82.00 P4 36.00 P3 18.20 P2 8.61 P1 0 4:00 (48 trading intervals) 4:00 8:00 12:00 00:00 20:00 16:00 Smart Generator Agent: Re-bidding Tuesday, 24/06/2003 $/MWh Ten price bands MW Generating Unit (Thermal – coal) Re-bid stack submitted at 22:00 on the previous day
Capacity Withholding Price ($/MWh) Evening peak 04.30 18.00 14.00 22.00 09.30 This 09.30 band was shifted down three times in the morning via rebids Quantity Offered (MW)
Thank you David Batten Coordinator, CSIRO Agent-Based Modelling Working Group CSIRO Marine & Atmospheric Research David.Batten@csiro.au