Download
1 / 18
180 likes | 419 Vues
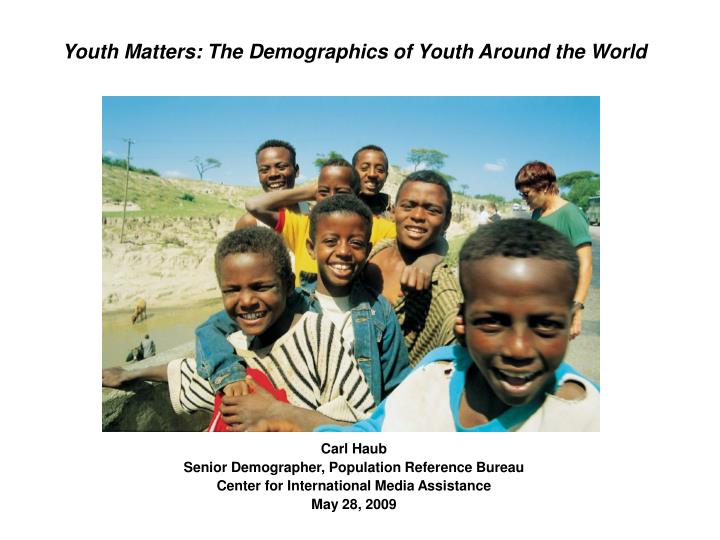
Youth Matters: The Demographics of Youth Around the World. Carl Haub Senior Demographer, Population Reference Bureau Center for International Media Assistance May 28, 2009. Who Are Youth?.

E N D
Youth Matters: The Demographics of Youth Around the World Carl Haub Senior Demographer, Population Reference Bureau Center for International Media Assistance May 28, 2009
Who Are Youth? • The United Nations defines “youth” as those ages 15-24, a definition first derived during the International Youth Year in 1985. “Children” are those below the age of 15. All UN youth statistics are shown for age 15-24. • The UN also allows for children to be those up to the age of 18 so that they might be covered under the UN’s Convention on the Rights of the Child. • Many individual countries limit youth to those below the age of majority (treated as an adult under the law), frequently age 18. • A major 2005 National Research Council study defined youth as ages 10-24. • The UN also distinguishes between teenagers (13 - 19) and “young adults” (20-24). • Because ready access to age data in many developing countries is in five year age groups, analysis using many specialized age groups can be difficult.
Projected World Youth Population, Ages 15–24, 1950 - 2050 Billions United Nations Population Division, World Population Prospects, the 2008 Revision
Projected World Youth Population, Ages 15–24, by Region, 1950 - 2050 Billions United Nations Population Division, World Population Prospects, the 2008 Revision
The “Youth Bulge” and the “Demographic Dividend” • The youth bulge is a somewhat vague concept, used with varying definitions or, at times, with no clear definition at all. • It may simply mean a large number of youth with the colorful term “bulge” only serving to confound the issue. • The bulge may be defined as those ages 15–24 or 15–29 as a percentage of the adult population, which may be adults age 30 or above or adults in the prime working ages 30 and above. • The demographic dividend is related to the bulge in that it is usually described in terms of a larger group in the working ages (especially the younger working ages) relative to those ages 0-14. • For that to happen, it is necessary that fertility decline to rather low levels so that the 0-4 age group is smaller than 5-9 for the first time. That has only begun to happen in some developing countries and is quite distant in most.
Graphing the Youth Bulge, Population 15–29 As a Percent of 30+Is a Large Number in the Young Working Age a Benefit by Itself? United Nations Population Division, World Population Prospects, the 2008 Revision
Nandan Nilekani on the Demographic Dividend Yes, in fact, I think the big change in India is that over the last 40 years we've gone from seeing a population as a burden to population as human capital. And the demographic dividend in particular arises because population growth rates have slowed down. And so we have a huge hump of people in the working age of 15-65, which is typically when economies grow very rapidly.---- Nandan Nilekani, co-founder of Infosys Marketplace, April 2, 2009
Population Pyramid, India, 2006 – Demographic Dividend? Age Females Males Percent of total population Population Reference Bureau projections, based on 2001 Census of India
Population Pyramid, Thailand, 2005 – Perhaps This Is the Demographic Dividend Age Females Males Percent of total population United Nations Population Division, World Population Prospects, the 2008 Revision
The “Demographic Divide” The Example of Nigeria and Japan NigeriaJapan Population 2008 (millions) 148 128 Population 2050 282 95 Lifetime Births per Woman 5.9 1.3 Annual Number of Births 6,300,000 1,100,000 Percent of Population Below Age 15 45 13 Population Below Age 15 66,000,000 17,000,000 Population Ages 15-24 30,000,000 13,000,000 Percent of Population Age 65+ 3 21 Life Expectancy at Birth 47 82 Annual Number of Infant Deaths 630,000 2,900 2008 World Population Data Sheet of the Population Reference Bureau
Population Under Age 15 (Percent) Around 1980 and 2008 ca. 1980ca. 2008 Western Africa 46 44 Middle Africa 43 46 Eastern Africa 46 44 Northern Africa 44 33 Southern Africa 42 33 India 41 32 China 32 19 1980 and 2008 World Population Data Sheets of the Population Reference Bureau
The Total Fertility Rate The total fertility rate (TFR) is the average number of children a woman would have in her lifetime if the rate of childbearing of a given year were to remain constant.An example from Nigeria: Age of mother Births per 1,000 women 15-19 122 20-24 224 25-29 265 30-34 242 35-39 161 40-44 88 45-49 42 Sum (TFR) times five 5720 2008 Demographic and Health Survey of Nigeria, preliminary report
Lifetime children per woman United Nations Population Division, Demographic and Health Surveys
Lifetime children per woman United Nations Population Division, Demographic and Health Surveys, Population Reference Bureau estimates
Total Fertility Rate, Five Latin American Countries, 1970, 2000/2003 and 2006/2008 Lifetime children per woman United Nations Population Division, Demographic and Health Surveys, Population Reference Bureau estimates
Total Fertility Rate in Pakistan, by Wealth Quintile, 2006-2007 2006-2007 Pakistan Demographic and Health Survey