Download
1 / 60
600 likes | 735 Vues
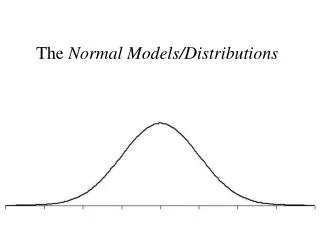
The Normal Models/Distributions. Normal Distribution Parameters. The first parameter specified here is shape: symmetric, unimodal, bell shaped. (A formula defines the exact shape.) For a Normal variable the mean and standard deviation are needed to proceed.

E N D
Normal Distribution Parameters The first parameter specified here is shape: symmetric, unimodal, bell shaped. (A formula defines the exact shape.) For a Normal variable the mean and standard deviation are needed to proceed. All else follows from knowing these three things.
Z-scores (Standardized Values) • Z measures • “how many standard deviations from the mean” • whether above (+) or below (-) the mean • This is the same formula, solved for X. • You are required to know these formulas.
The gestation period (length of pregnancy) for women is Normally distributed with mean = 270 days and standard deviation = 11 days. Draw a picture! Example
Use the mean to get started. Example
On the templates, consecutive tick marks are one standard deviation apart. Example
68 – 95 – 99.7 Rulealso known as theEmpirical Rule A reference to getting started with Normal distributions. About 68% of the data fall within 1 standard deviation of the mean:
Example 0.6827
A reference to getting started with Normal distributions. About 95% (all but roughly 1 out of 20) of the data fall within 2 standard deviations of the mean: 2 Empirical (68 – 95 – 99.7) Rule
Example 0.9544
A reference to getting started with Normal distributions. About 99.7% (all but roughly 1 in 370) of the data fall within 3 standard deviations of the mean: 3 Empirical (68 – 95 – 99.7) Rule
Example 0.9973
0.0027 or about 1 in 370 data values (on average) fall outside 3. Technically the minimum and maximum are - and + (infinite). Values far to the right and left have very very very very small likelihood. Data more than 3 from
0.00135 =1/741 values more than 3 above Beyond + 3 0.0000317 =1/31574 values more than 4 above • If the curve were drawn 1 mm high at 6 from , then it would be drawn 65.66 km high at .
The Z scale “goes with” the data scale. Z = # of standard deviations from the mean. Example
Determine the probability a pregnancy lasts at least 274 days (that’s 9 months). Example
Finding Probabilities To solve a problem asking for a probability with for a Normal distribution: Step 1. Draw a picture identifying the relevant area.
Determine the probability a pregnancy lasts at least 274 days. Example
Determine the probability a pregnancy lasts at least 274 days. Example
Determine the probability a pregnancy lasts at least 274 days. Example Area = Probability
Finding Probabilities To solve a problem asking for a probability with for a Normal distribution: Step 2. Convert the data value to the Z scale. Data = 274 = 270 = 11 days 274 is 0.36 standard deviations above the mean
Determine the probability a pregnancy lasts at least 274 days. Example
Finding Probabilities To solve a problem asking for a probability with for a Normal distribution: Step 3. Use the Table (A-2 in the book) or computer or calculator to determine the percentile for the value. A Z-score of 0.36 matches with a probability of 0.6406. That is: Z = 0.36 is the 64.06 percentile.
Determine the probability a pregnancy lasts at least 274 days. Example 0.6406
Finding Probabilities To solve a problem asking for a probability with for a Normal distribution: Step 4. Problems asking for the probability of a result above or between will require further operations, because of the way percentiles are oriented.
Example 0.6406 1 – 0.6406 = 0.3594 coincidence
Example - Solution 0.3594 is the probability that a pregnancy lasts at least 274 days. That is: 35.94% of all pregnancies last at least 274 days. (Probability calculations always apply to populations.) 274 days is the 64 percentile of gestation times.
The gestation period (length of pregnancy) for women is Normally distributed with mean = 270 days and standard deviation = 11 days. Example
Example A women gave birth to a child on October 2, 2007. She identifies a man as the father. The case is in court. The man testifies he is not the father, and documents that he was out of the country from December 19, 2006 to January 30, 2007. December 19 is 287 days before October 2. January 30 is 245 days before October 2. What is the probability a pregnancy lasts between 245 and 287 days? (If it’s high, then we have evidence – in the data – supporting the man’s claim that he is not the father.)
What’s the probability the pregnancy lasted between 245 and 287 days? Example
What’s the probability the pregnancy lasted between 245 and 287 days? Example
What’s the probability the pregnancy lasted between 245 and 287 days? Example Area = Probability
Data = 245 Data = 287 Convert both data values to the Z scale. 245 is 2.27 standard deviations below the mean 287 is 1.55 standard deviations above the mean
What’s the probability the pregnancy lasted between 145 and 287 days? Example Area = Probability
What’s the probability the pregnancy lasted between 145 and 287 days? Example 0.9394 = Area below 287 (1.55)
What’s the probability the pregnancy lasted between 145 and 287 days? Example 0.9394 = Area below 287 (1.55) 0.0116 = Area below 245 (-2.27)
What’s the probability the pregnancy lasted between 145 and 287 days? Example 0.9394 = Area below 287 (1.55) 0.0116 = Area below 245 (-2.27) 0.9278 = Area between 245 and 287
Example - Solution 0.9278 is the probability that a pregnancy lasts between 245 and 287 days. We found 245 to be the 1.16 percentile of pregnancy lengths. We found 287 to be the 93.94 percentile.
Example - Solution 0.9266 is the probability that the woman’s pregnancy had a length that proves the man’s innocence. Note: This is not the probability the man is not the father. In our way of thinking about things, there is no such thing as “the probability the man is the father.” Either he is or is not the father. (We just don’t know.)
Example Determine the first quartile of the pregnancy lengths. First draw a picture.
Determine the first quartile. Example 0.2500 = Area
Example Determine the first quartile of the pregnancy lengths. Notice that the Z value will be negative.
Determine the first quartile. Example 0.2500
Example Determine the first quartile of the pregnancy lengths. In problems like these – where the probability is given – the steps of the previous problems are reversed.
Example The steps of the previous problems are reversed. From the given probability / percentile, determine the Z-score. Since 0.2500 is the probability of a result less than Q1: Z -0.67 (Better tools give -0.674.)
Determine the first quartile. Example 0.2500
Example You have the Z score (–0.67). Use either of the given equations to obtain the data value X.
Determine the first quartile. Q1 = 262.63 Example 0.2500
Example You have the Z score (–0.67). Use either of the given equations to obtain the data value X.