Download
1 / 25
250 likes | 400 Vues
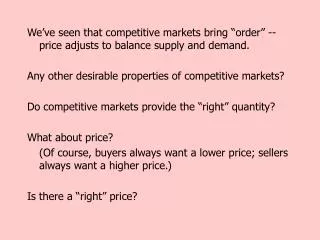
We’ve seen that competitive markets bring “order” -- price adjusts to balance supply and demand. Any other desirable properties of competitive markets? Do competitive markets provide the “right” quantity? What about price?

E N D
We’ve seen that competitive markets bring “order” -- price adjusts to balance supply and demand. Any other desirable properties of competitive markets? Do competitive markets provide the “right” quantity? What about price? (Of course, buyers always want a lower price; sellers always want a higher price.) Is there a “right” price?
These questions bring us to the topic of Welfare economics: The study of how the allocation of resources affects economic well-being. Both buyers and sellers benefit from their participation in the market. (Remember “basic principle #5”!) We will need to develop tools for measuring, in dollar terms, buyers’ and sellers’ benefits from market participation. “consumer and producer surplus”
Willingness to pay (WTP): The maximum amount that a consumer will pay for a particular unit of a good. For a given consumer, WTP varies among units of a good (higher WTP for first unit than for second, etc.). WTP also varies across consumers (some have “high” WTP; some “low” WTP). WTP is a measure, in dollar terms, of the value to the consumer of that unit of the good.
Consumer surplus: A consumer’s willingness to pay minus the amount the consumer actually pays = “value” to consumer minus amount paid. Consumer surplus and demand curves? An example: The market for gizmos. Assume: . . . people differ in their WTP for the first gizmo of the day, . . . but everyone has zero WTP for the second, third, fourth, etc. gizmo each day. (Gizmos are nice to have, but nobody needs more than one per day!)
Suppose there are five consumers who differ in their WTP for a gizmo:
As price falls below 1.00, Al’s demand “kicks in.” ($/gizmo) 1.00 As price falls below 0.80, Betty’s demand “kicks in.” 0.80 0.70 0.50 And so on . . . quantity demanded increases by 1 as each level of WTP is reached. 0.30 (gizmos/day) 1 2 3 4 5 The market demand curve for gizmos: Start off with price above $1.00/gizmo, and gradually reduce price.
Suppose that the price of a gizmo is $0.60/gizmo. Quantity demanded is 3 gizmos/day. (Al, Betty, and Carl demand; Doug and Emily don’t.) ($/gizmo) 1.00 0.60 (gizmos/day) 3 5 Here’s that demand curve again: Al’s C.S. = WTP - p = 1.00 - 0.60 = 0.40. Betty’s C.S. = 0.80 - 0.60 = 0.20. Carl’s C.S. = 0.70 - 0.60 = 0.10. Total C.S. ($0.70/day) = area below demand, above mkt. price.
($/unit) With price at the level p1 . . . . . . and quantity purchased and consumed at Q1 . . . p1 Demand Q1 (units/day) . . . consumer surplus is the (shaded) area below the demand curve and above market price, over the range of quantity purchased and consumed. Now in terms of a more “conventional” demand curve:
One more thing to notice from this construction of demand: The demand price at any quantity measures the willingness to pay (“value”) for the marginal consumer (the first consumer who would leave the market if price were to increase). For this reason, the demand curve is sometimes described as a graph of “marginal value.”
Consumer surplus gives a measure (in dollar terms) of buyers’ benefits from market participation. What about sellers? Opportunity cost: The value of what must be given up to produce a particular unit of the good. As such, opportunity cost is the minimum amount that a seller would be willing to accept for that unit.
For a given seller, opportunity cost can vary across units of a good. Opportunity cost can also vary across sellers (some might be “high” cost sellers; others “low” cost sellers.) Producer surplus: The amount a seller is paid for a good minus the seller’s opportunity cost of producing it.
Producer surplus and supply curves? Gizmos again. Assume: . . . suppliers differ in their opportunity cost of the first gizmo produced per day. . . . but all producers have infinite opportunity cost for the second, third, etc. gizmo each day. (It’s impossible to produce more than one gizmo per day.)
Suppose there are five suppliers who differ in their opportunity cost of a gizmo:
($/gizmo) As price rises above 0.25, Arliss’ supply “kicks in.” 1.25 As price rises above 0.50, Bob’s supply “kicks in.” 1.00 0.70 And so on . . . quantity supplied increase by 1 as each level of opportunity cost is reached. 0.50 0.25 1 2 3 4 5 (gizmos/day) The market supply curve for gizmos: Start off with price at zero and gradually increase it.
Suppose that the price of a gizmo is $0.75/gizmo.) Quantity supplied is 3 gizmos/day. (Arliss, Bob, and Cindy supply; Denise and Edgar don’t.) ($/gizmo) 1.25 0.75 0.25 3 5 (gizmos/day) Here’s that supply curve again: Arliss’ P.S. = p - opp. cost = 0.75 - 0.25 = 0.50 Bob’s P.S. = 0.75 - 0.50 = 0.25 Cindy’s P.S. = 0.75 - 0.70 = 0.05 Total P.S. ($0.80/day) = area above supply, below mkt. price.
($/unit) With price at the level of p1 . . . Supply p1 . . . and quantity produced and sold at Q1 . . . Q1 (units/day) . . . producer surplus is the (shaded) area above the supply curve and below market price, over the range of quantity produced and sold. Now in terms of a more “conventional” supply curve:
One more thing to notice from this construction of supply: The supply price at any quantity measures the opportunity cost for the marginal producer (the first producer who would leave the market if price were to decrease). For this reason, it’s legitimate to think of the supply curve as a graph of “marginal cost.”
Consumer and producer surplus measure, in dollar terms, consumers’ and producers’ benefits from market participation. Consumer surplus measures an implicit benefit -- it doesn’t really show up as dollars in our pocket. Instead, it’s the difference between the maximum amount we would have willingly paid, for all units purchased, and the amount we actually do pay. Producer surplus is more explicit -- it’s closely related to the concept of “profit.” (More later.)
Value to buyers Amount paid by buyers Consumer surplus = - Amount received by sellers Cost to sellers Producer surplus - = Producer surplus Consumer surplus Total surplus = + Value to buyers Cost to sellers = - If total surplus is maximized, we say that “efficiency” is achieved.
Some conditions for efficiency: The total quantity of goods supplied must be allocated to the buyers who value them most highly. (Otherwise, total value to buyers could be increased by a transfer from one buyer to another.) The total quantity of goods demanded must be allocated to sellers who can produce them at least cost. (Otherwise, total cost to sellers could be decreased by a transfer from one seller to another.)
($/unit) A Supply E p* (those on AE) C Demand Q* (units/day) (those on CE) Let’s see if these conditions are met in competitive market equilibrium. The “price rationing” mechanism of competitive markets achieves these conditions. Only buyers who value the good higher than p* . . . . . . will buy. Only sellers whose cost is lower than p* . . . . . . will sell. Rationing by price achieves the “right” allocations on both sides of the market.
There’s one more condition that must be satisfied for efficiency (maximization of total surplus): We must have production, trade, and consumption of all units for which marginal value exceeds marginal cost . . . . . . (all units for which WTP of the marginal buyer exceeds opportunity cost of the marginal seller) . . . . . . so that all potential gains from trade will be realized.
At output Q1 (less than Q*), marginal value . . . ($/unit) marginal value Supply marginal cost At output Q2 (greater than Q*), marginal value . . . p* Demand Q1 Q2 Q* (units/day) marginal cost marginal value Is this condition achieved in competitive equilibrium? . . . exceeds marginal cost. . . .is less than marginal cost. Efficiency requires trade of all units up to Q* . . . none beyond. The equilibrium quantity is the “right” quantity in this sense.
So in competitive market equilibrium, efficiency is achieved (total surplus is maximized). The “right” quantity of output is produced, traded, and consumed . . . . . . and it’s allocated (by the price rationing mechanism) in the “right” way. (Buyers with the highest values buy. Sellers with the lowest costs sell.) Remember basic principle #6: “Markets are usually a good way to organize economic activity”?
One very (!) important caveat to all of this: Efficiency -- maximization of total surplus -- has to do with the size of the “pie.” We can (and should!) still worry about how the pie is divided among society’s members. These are “equity” issues.