Failure Analysis Reporting
Failure Analysis Reporting. David M. Christie Senior Failure Analyst IMR Test Labs. Failure Analysis Report. The two dimensional representation of your analysis of a three dimensional phenomenon Must be clearly organized


Failure Analysis Reporting
E N D
Presentation Transcript
Failure Analysis Reporting David M. Christie Senior Failure Analyst IMR Test Labs
Failure Analysis Report • The two dimensional representation of your analysis of a three dimensional phenomenon • Must be clearly organized • Should present all the relevant data, in a way that is readable and logical • Of particular importance are these: • The photographic evidence • The conclusions you draw from the evidence. • The reader WILL look at your photos. They must be high quality, and well organized. • The readers are looking for a conclusion, the “answer”, the “silver bullet” that will explain the disaster that had them send the parts to you: To the extent possible, provide a conclusion or set of conclusions.
Failure Analysis Report • Suggested Format (Organization follows logical examination of subject mat’l): • Title page • All relevant part descriptors and Report number, Authors and Reviewers • Summary Conclusion of Findings – Some readers will go no further than this page, so make it easy on them. Bullet points sometimes work best. Should fit on a single page. • Parts Received/Background Information • Detail what was received, part numbers, drawing numbers, form (eg: forging), alloy (chemistry), expected tensile strength or hardness, etc. • Background information: Any information you have surrounding the failure that is relevant to your conclusions (Failure rate, time in life cycle of part, brief history of the part, new or mature design, previous failures similar or not, etc.) • Scope of analysis: What questions are you trying to answer? (can be customer-driven) Often it is “root cause” related. Sometimes the questions are very specific (Did the pipe fail from ID or OD?)
Failure Analysis Report • Methods • Detail the methods you use to complete the analysis. This can be simple (visual examination, fractography, etc.) or detailed (ASTM A 262 Practice A) • Visual Examination • What can be seen with the un-aided eye, and with a stereo microscope. Also could be called “Optical Examination” • The entire part or set of parts is examined. • Usually, the fracture surface is not examined and reported in this section. • SEM Examination/ EDS Analysis • Typically this is primarily the examination of the fracture surfaces, but may include relevant part surfaces. Both optical and SEM observations of the fracture surface are included. • EDS results usually go in this section as well
Failure Analysis Report • Cross Sections/ Microstructure • Chemistry, hardness, mechanical properties, fatigue test results, etc. • Conclusions : if you have not made them part of the cover page • Discussion – sometimes required to fully explain results, cite references from published literature, educate the reader, etc. • Glossary of terms • This is a good way of making the report accessible to a wide audience, and still maintaining brevity in the body of the report. • Details of Test Methods • Sometimes test apparatus and methods require additional documentation, and a separate section makes the report body read easier. • Appendices • Formulas used to make calculations, conversion tables, equations, etc.
Failure Analysis Report Other Key Points: • Good photographic evidence to support text • In the relevant text section, refer to each photo in sequence, by Figure number. No un-referenced figures should be in the report. • Photos zoom in at increasing magnification so the reader knows “where he/she is” at all times. • If multiple parts are involved, you will need to decide if you report part by part, or feature by feature across parts. • Photos annotated to aid in description of key features. • All photos with captions and scale bars.
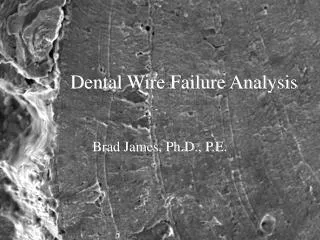
Failure Analysis Report Small tube fractured near braze joint. The fracture surface was highly damaged by post fracture rubbing between mating surfaces. It was important to identify both the fracture mechanism, the locations of origins, and direction of propagation. This image is the summary of meticulous SEM examination of the small depressions in which fatigue features were found. The fracture origin is likely at the 5:00 clock position.
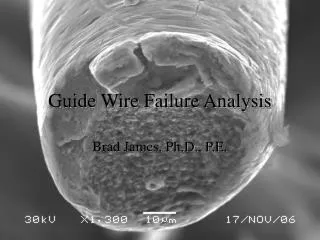
Failure Analysis Report The next image zooms in on the top half of the fracture. The small rectangle shows the location of the next image.
Failure Analysis Report At this magnification the direction of fatigue propagation is evident. Without the preceding images, it would not be clear to the reader where on the part this image was taken.
Failure Analysis Report Other Key Points: • Have All Bases Covered: • All possible fracture morphologies or failure mechanisms addressed, given the evidence, with explanations that zero in on the “root cause”. Note that in some instances, the evidence might not support a definitive conclusion. • Recommendations • Some clients want these, some do not. (design, material selection, processing, use, etc.)
Failure Analysis Report • Suggestions: • First organize your photos • Print multiple images on a single page (9 works well) • Number the images with marker, as you compose in your mind the text that will refer to the images. This will help you get the order “right”. • Lay out the multiple image sheets to refer to as you compose the body text of the report. • Think of your report as a slide show, with text as your narrative to the slide show. This will help you to make a logical presentation. • Picture captions are done last.
Failure Analysis Report • Lastly: • HAVE A QUALIFIED PERSON REVIEW YOUR REPORT BEFORE PRESSING “SEND”!