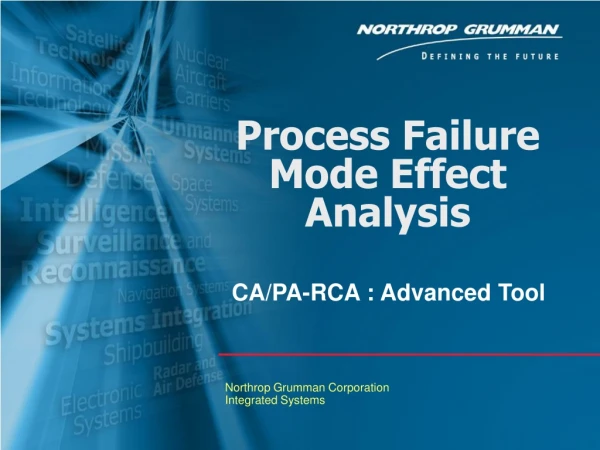
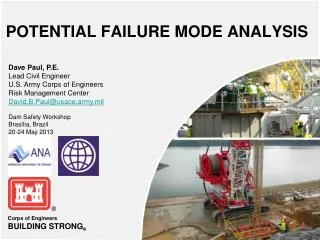
POTENTIAL FAILURE MODE ANALYSIS
Dave Paul, P.E. Lead Civil Engineer U.S. Army Corps of Engineers Risk Management Center David.B.Paul@usace.army.mil Dam Safety Workshop Brasília, Brazil 20-24 May 2013. POTENTIAL FAILURE MODE ANALYSIS. Best Practices in Dam and Levee Safety Risk Analysis. Dave Paul, P.E.

POTENTIAL FAILURE MODE ANALYSIS
E N D
Presentation Transcript
Dave Paul, P.E. Lead Civil Engineer U.S. Army Corps of Engineers Risk Management Center David.B.Paul@usace.army.mil Dam Safety Workshop Brasília, Brazil 20-24 May 2013 POTENTIAL FAILURE MODE ANALYSIS
Best Practices in Dam and Levee Safety Risk Analysis Dave Paul, P.E. Lead Civil Engineer US Army Corps of Engineers Risk Management Center Potential Failure Mode Analysis
Origins • US Bureau of Reclamation performed initial deterministic studies for all of its dams. A way to look after the dams long term. • Previous teams had tried to develop “minimum instrumentation requirements”, but could not agree on what they should be. • Team was formed to develop a process to address the long term monitoring issues. • The Probable Failure Mode Analyses (PFMA) process was developed.
Examination of Past Failures and their Causes • It is interesting to note that post-Teton dam safety laws were targeted toward changes in the state-of-the-art, seismic loading, and floods, the latter two of which could be analyzed, and the first being difficult to define. • Teton Dam failed by internal erosion, but this failure mode was not directly mentioned. • Yet, data suggests that most large dam failures (in the Western U.S.) were the result of internal erosion. • Standards based analyses are not the complete dam safety picture.
Definitions • Risk – the probability of adverse consequences • P(load) x P(failure) given the load x Consequences given failure • Risk Analysis – A quantitative calculation or qualitative evaluation of risk • Risk Assessment – The process of deciding whether risk reduction actions are needed
Dam Safety Risk Analysis is New? “The possibility of failure must not be lost sight of. To sum up in a concrete manner, it is my judgment that the chances of failure with the water at varying elevations will be substantially as follows: In case of failure, while there might be no loss of life, yet the loss in time, in property, in money and in prestige would many times over exceed the cost of even an entirely new structure.” Thaddeus Merriman, New York, February 21, 1912 LIKELIHOOD CONSEQUENCES
Why Risk Analysis? • Following the failure of Teton Dam in 1976, US Bureau of Reclamation was asked to begin developing risk analysis methodology for dams (risk is mentioned in dam safety legislation) • USACE recognized need to implement risk analysis following failure of levees in New Orleans during Hurricane Katrina • Need to improve and balance risk reduction benefits with limited budget (e.g. upgrading a few dams to pass the PMF vs. using available budget to reduce risk at many dams) • More transparency and justification for dam and levee safety decisions was desired
Guiding Principles • Risk analysis procedures, although quantitative, do not provide precise numerical results. Thus, the nature of the risk evaluation needs to be advisory, not prescriptive, such that site specific considerations, good logic, and all relevant external factors could be applied in decision making, rather than reliance on a ‘cookbook’ numeric criteria approach. • The numbers, while important, are less important than understanding and clearly documenting what the major risk contributors are and why.
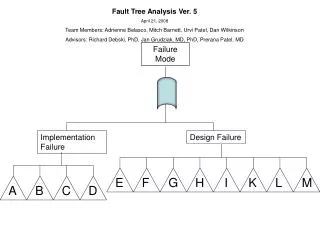
Building Blocks • Seismic and Hydrologic Hazard Assessments • Failure Mode Analysis and Screening • Event Trees and System Response Curves • Probabilistic Analysis and Models • Subjective Probability and Expert Elicitation • Consequence Evaluation • Remainder of course will focus on these and their application to specific potential failure modes, as well as how to convey the results
Example to Illustrate Process MCE Analysis Red – tensile stresses exceed strength
Failure Mode Description • Unedited (insufficient detail): Failure of the concrete dam during an earthquake • Edited: (1) As a result of strong earthquake ground shaking during a period of high reservoir elevation, (2) cracking initiates at the change in slope on the downstream face of the concrete gravity dam at about elevation 3514. Due to cyclic “rocking” of the structure, the dam cracks completely through monoliths on either side of the spillway. Sliding initiates during the shaking, perhaps causing enough displacement to dilate the sliding plane and offset and shear the formed drains. This potentially leads to an increase in uplift on the cracked section and post-earthquake instability. (3) The dam breaches by sudden sliding of several monoliths down to elevation 3514.
Event Tree Can use system response curves to define conditional response nodes Post E.Q. Instability Sliding Disrupts Drainage Seismic Load Ranges Section Cracks Through Reservoir Load Ranges Post E.Q. Instability Lower load range is threshold
Reservoir Exceedance Curves 0.68 0.68 – 0.55 = 0.13 0.55
Load Ranges • To obtain a mean load range probability, subtract the probability of the lower load from the probability of the upper. 0.20g P = 0.0003 P = 0.000255 0.40g P = 0.000045
Likelihood of Cracking Through Series of analyses using representative ground motions for each ground motion range
Likelihood of Cracking Through • Adverse Factors • Tensile stress on u/s face exceeds estimated dynamic tensile strength for load ranges 5-6 • Cracks may propagate more readily than nonlinear analysis accounts for • Favorable Factors • Tensile stress on u/s face is less than estimated dynamic tensile strength for load ranges 2-4 • Coring showed good bond at lift joints • Nonlinear analysis showed only one monolith would crack through at load range 6
Verbal Descriptors *Use sparingly – Reagan’s research showed that people are not well calibrated below about 0.01
Likelihood of Displacement/ Increase in Uplift • Adverse Factors • Nonlinear analysis showed displacements greater than drain diameter at seismic load range 6. • Dilation on sliding plane could increase uplift without displacing drains • Favorable Factors • Nonlinear analysis showed displacements less than ½ the drain diameter at seismic load ranges 2 – 5 • Nonlinear analysis assumed lift was cracked at beginning of E.Q. when in fact it is bonded • Nonlinear model did not include embankment wrap-around which could reduce sliding at ends, causing rotation and binding at contraction joints
Likelihood of Post E.Q. Instability Probabilistic Stability Analysis Methodology • Program “deterministic” analysis in Microsoft Excel • Use @Risk – commercially available Macro add-in • Instead of defining input parameters as single values, define them as distributions • Perform “Monte-Carlo” analysis using @Risk to calculate many factors of safety by sampling input distributions • Use the output distribution of safety factor to determine the probability of unsatisfactory performance (e.g. probability of F.S.<1.0) • Prob F.S.<1.0 = (Number of F.S.<1.0) / (Total No. F.S.)
F.S. Output(10,000 iterations) Prob. F.S. < 1.0 = 228/10,000 = 0.0228
Consequences Graham, 1999 – 50 case studies. Does not include large populations and long warning times
Build the Case • Claim: • The lift joints near the spillway crest are well bonded and have significant strength. This leads to a low likelihood (0.1 or less) of cracking through the section at 1/10,000 AEP or smaller ground motions. • Evidence: • All lift joints near the spillway elevation were recovered intact in core drilling • There were a large number of tests indicating high tensile strength across joints (report numbers) • Construction control procedures were excellent (describe) • Stresses are less than estimated strength (enumerate)
Key Concepts • Collect all relevant background material • Take a fresh look, (group dynamics) • Review background material diligently (by more than one qualified engineer) • Perform site examination with eye toward potential vulnerabilities • Involve operating personnel in the potential failure modes discussions • Think beyond traditional analyses
Identifying • Done in team setting with diverse group of qualified personnel • Facilitator (or Senior Engineer) elicits candidate potential failure modes based on team’s understanding of vulnerabilities • Facilitator (or Senior Engineer) makes sure each potential failure mode is understood and described thoroughly • Post large size scale drawings/sections and sketch out the failure modes (as appropriate)
Describing • Three elements of a potential failure mode description are: • The Initiator (e.g. Reservoir load, Deterioration/ aging, Operation malfunction, Earthquake) • The Failure Mechanism (including location and/or path) (Step-by-step progression) • The Resulting Impact on the Structure (e.g. Rapidity of failure, Breach characteristics)
Example Review of geology indicated dam is founded on horizontally-bedded shale and clay seams Surveying results indicated the dam had moved several inches since monitoring began
Example (cont.) • Unedited (insufficient detail): Sliding of the concrete dam foundation • Edited:As a result of high reservoir levels and (1) a continuing increase in uplift pressure on the old shale layer slide plane, or (2) a decrease in shearing resistance due to gradual creep on the slide plane, sliding of the buttresses initiates. Major differential movement between two buttresses takes place causing the deck slabs to be unseated from their simply supported condition on the corbels. Breaching failure of the concrete dam through two bays quickly results followed by failure of adjacent buttresses due to lateral water load.
Review Consequences of Failure • If the Dam were to breach by this mechanism, at risk would be a highway, a railroad, two bridges, farmhouses, a gas pumping station, an aggregate plant, a barley mill, a transmission line, and the town of Ledger. There is little recreation activity downstream of the dam. The total population at risk is estimated at about 1400. • The embankment is constructed of silty material with a low PI and the alluvium is mostly cohesionless sand, a rapid erosion breach would likely occur down to bedrock. • (But, don’t rule out a potential failure mode with low consequences if it has a high likelihood of occurrence)
Analysis • For each potential failure mode: • List adverse or “more likely” factors • List favorable or “less likely” factors • Flesh them out so they can be understood by others and years down the road (ask, “why did we say that?,” and write down the answer) • Perform an evaluation of the potential risk – suggest using semi-quantitative approach described in next section.
Adverse “More Likely” Factors • The gravel alluvium in contact with the embankment core on the downstream side of the cutoff trench is similar to the transition zones which do not meet modern “no erosion” filter criteria relative to the core base soil. • The gravel alluvium may be internally unstable, leading to erosion of the finer fraction through the coarser fraction and even worse filter compatibility with the core. • The reservoir has never filled to the top of joint use; it has only been within 9 feet of this level; most dam failures occur at high reservoir levels; the reservoir would fill here for a 50 to 100-year snow pack (based on reservoir exceedance probability curves from historical operation). • The core can sustain a roof or pipe; the material was well compacted (to 100 percent of laboratory maximum), and contains some plasticity (average Plasticity Index ~ 11). • There is likely a significant seepage gradient from the core into the downstream gravel foundation, as evidenced by the hydraulic piezometers installed during original construction (and since abandoned). • It is likely that all flow through the foundation cannot be observed due to the thickness and pervious nature (transmissivity) of the alluvium.
Favorable or “Less Likely” Factors • Very little seepage is seen downstream; the weir at the downstream toe, which records about 10 gal/min at high reservoir when there is no preceding precipitation, indicating the core is relatively impermeable; these flow rates may be too small to initiate erosion. • The core material is well compacted (to 100 percent of laboratory maximum) and has some plasticity (average Plasticity Index ~ 11), both of which reduce its susceptibility to erosion. • No benches were left in the excavation profile that could cause cracking and the abutments were excavated to smooth slopes less than 2H:1V. • If erosion of the core initiates, the gravel alluvium may plug off before complete breach occurs (see criteria for “some erosion” or “excessive erosion”, Foster and Fell, 2001).
Screening • The risk for each potential failure mode can be screened at this point using the semi-quantitative approach described in the next section.
Potential Failure Mode Considerations • Reduced spillway capacity (debris, gate malfunction, orifice flow under gates, fuse plug fails to erode, etc.) leads to overtopping erosion • Mis-operation due to faulty instrumentation • Stagnation pressure or cavitation failure of spillway chutes or linings • Overtopping of spillway walls leading to erosion • Failure of large spillway gates releasing life-threatening flows (inadvertent opening from communications problem or drum gate lowering, buckling of radial gate arms (seismic or friction))
Potential Failure Mode Considerations (cont.) • Piping of alluvial material from beneath concrete dams • Internal erosion of embankments • Along vulnerable paths including adjacent or into conduits or walls and into drains • Through flaws caused by differential settlement, arching, poor construction, etc. • Into geologic defects such as open joints or open-work gravel • From low permeability layer at toe of embankment perhaps leading to heave or blow-out
Potential Failure Mode Considerations (cont.) • Differential deformation leading to stresses exceeding the structural capacity • Sliding on weak lifts in buttress dams • Plugging of drains or unprecedented reservoir loads perhaps leading to the following: • Sliding along weak discontinuities in the foundation of concrete dams • Sliding on poorly bonded lift joints in concrete gravity dams
Potential Failure Mode Considerations (cont.) • Seismic failure of spillway piers and loss of gates • Seismic failure of spillway walls and embankment erosion • Seismic liquefaction, deformation exceeds freeboard or seepage erosion through cracks • Seismic cracking/ sliding of concrete gravity dams or buttress dams • Seismic cracking/ displacement of concrete arch dams • Seismic failure of dam buttresses due to cross canyon loading
Dave Paul, P.E. Lead Civil Engineer Risk Management Center INTERIM RISK REDUCTION MEASURES With Acknowledgments to: Jacob Davis, P.E., Geotechnical Engineer w/ RMC Jeff McClenathan, P.E., Senior H&H with RMC
Risk Definition Risk = (Load Probability)(Failure Probability|Load)(Consequences of Failure)
IRRMP Objective • The IRRMs are a short-term approach to reduce Dam Safety risks while long-term solutions are being pursued. • IRRMs should lower the probability of failure and associated consequences to the maximum extent reasonable. • Some IRRMs may have longer durations than others based on national risk prioritization queue.
IRRM Principles • “…it is not appropriate to refer to balancing or trading off public safety with other project benefits. Instead, it is after public safety tolerable risk guidelines are met that other project purposes and objectives will be considered. Dam Safety Officers are the designated advisors and advocates for life safety decisions.”
IRRM Principles • Decisions are risk-informed and not risk-based. • Risk-informed decisions integrate traditional engineering analyses and judgment. • General public safety responsibility requires USACE to assure our projects are adequately safe from catastrophic failure that results in uncontrolled release of the water in the reservoir.
IRRMP Principles • Timely – Will the measure be implemented in a timely manner to reduce risk? • Cost – Is the cost of the measure within budgetary threshold for major maintenance or O&M as outlined in the current budget EC? • No new risk – Does the measure increase the overall risk from the dam to the downstream public?
IRRM Principles • Do no harm: The principle of ‘Do no harm’ should underpin all actions intended to reduce dam safety risk. Applying this principle will ensure that proposed IRRM implementation would not result in the dam safety being compromised at any point in time or during IRRM implementation
FIRST -“DO NO HARM” Modifications to Existing Dams
IRRM Plans • Long-term life-safety guidelines should be met by IRRM’s wherever available non-structural and appropriate structural measures exist. • Chapter 7 provides risk guidance for when IRRM’s should be implemented faster. • Chapter 7 provides suggestions on evaluating proposed IRRM’s for implementation