Measurement Techniques for Windblown Dust: Insights from the Southwest Border Symposium
This presentation provides a comprehensive overview of windblown dust (WBD) measurement techniques. Windblown dust is one of the largest sources of atmospheric aerosol, with significant contributions from both natural and anthropogenic sources. We discuss various measurement methodologies, including direct measurement, use of sand as a surrogate, and wind tunnel experiments. The mechanisms underlying dust emission and their influence on atmospheric conditions are examined, along with considerations of soil conditions and landscape roughness. This work aims to enhance understanding of WBD dynamics for air quality assessment.

Measurement Techniques for Windblown Dust: Insights from the Southwest Border Symposium
E N D
Presentation Transcript
Windblown dust measurement (field) Vic Etyemezian DRI Las Vegas, NV Prepared for The Southwest Border Symposium on Air Quality and Climate, April 22-23, 2013, Las Cruces, NM
Outline • Introduction • Overview of mechanism • Direct measurement • Inferential measurement (using sand as a surrogate) • Wind tunnel measurement • Soil condition considerations • Roughness considerations
Windblown dust (WBD) • Among largest sources of atmospheric aerosol (about 1,000 terragrams or 1 billion tons per year) • Mostly natural (75%, Ginoux et al., 2012) and significant fraction (30%, Ginoux et al., 2012) related to hydrologic processes. • Largely from African continent, but all non-polar continents have significant dust sources Ginoux, P., J. M. Prospero, T. E. Gill, N. C. Hsu, and M. Zhao (2012), Global-scale attribution of anthropogenic and natural dust sources and their emission rates based on MODIS Deep Blue aerosol products, Rev. Geophys., 50, RG3005, doi:10.1029/2012RG000388.
Scales • Global(104 km) /Continental (103 km)/Regional (102 km)/ Local (10 km) • Remote sensing • Models (e.g. NAAPS, http://www.nrlmry.navy.mil/aerosol/ ) • Local (10 km)/ Field (1 km) • Remote sensing – source identification tricky • Models – inhomogeneous terrain and parameter specification tricky • On-site measurements can provide useful information
Mechanisms of Windblown Dust Suspension • Creep • 0.5 - 2 mm particles roll due to pressure differential • Saltation • 0.1 - 0.5 mm particles suspended, travel parallel to ground 1-5 m, re-impact • Cause release of additional particles • Emission • 0.001 - 0.1 mm particles suspended and transported between 10 – 10,000 m
Mechanisms of dust emission http://www.weru.ksu.edu/
Direct measurement of WBD • Dale A. Gillette (DAG) largely championed approach • Measure profile of wind speed and dust concentration during WBD event • Use theoretical considerations to calculate upward flux of dust • In practice, DAG used sand flux as surrogate for dust concentration for measurement ease • Advantage: Defensible measure of emissions under real-world conditions • Disadvantage: Requires substantial field infrastructure and presence during dust event(s); assumes homogeneous source strength
Inference from sand flux • Saltation (sand ballistic impacts on soil) is primary means of emitting dust • The amount of sand that is carried across a line should relate to the amount of dust that has been emitted from the surface • In some instances, dust emission is assumed proportional to sand flux (e.g., Gillette et al., 2004) Gillette, D.A., Ono, D. and Richmond, K. 2004. A combined modeling and measurement technique for estimating windblown dust emissions at Owens (dry) Lake, California. Journal of Geophysical Research. Earth Surface 109, F01003, doi:10.1029/2003JF000025
Sand flux • Integrated samplers (e.g., BSNE, Cox sand catcher) • Reliable, inexpensive, does the job, provides physical sample • No time resolution, labor-intensive
Sand flux (cont.) • Electronic sensors (e.g., saltiphone, SensitTM, Safire, Wenglor, other optical gate sensors) • Vibration/sound • Extinction/optical gate • Advantages: Time resolution for linking with wind conditions • Disadvantages: No physical sample, sensitivity issues, requires electronic infrastructure
Sand Flux (cont.) • NSF-funded project to develop new real-time sensor using optical gate technology • Includes WS/WD, T, Sand sensor + trap, power source, data logger w/memory card • Promisingfor sand sizing as well as mass
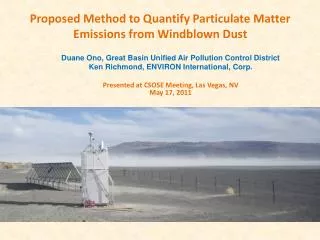
In-situ measurement of WBD potential • Conduct measurements in field using wind tunnel or similar technology • Identify soil/landform characteristics that can be grouped • Conduct erodibility measurements to obtain response of soil to wind stress • Use range of results to estimate response of soil/landform • Apply other corrections for weather, soil conditions, and surface cover
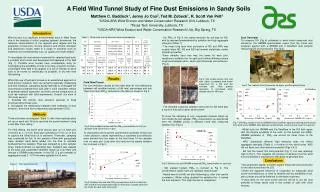
Field wind tunnels • To obey fluid and saltation scaling laws, wind tunnel must be large
Field wind tunnels (cont.) • Advantages: • No need to wait for dust • Can examine subsets of landscape, soil conditions, wind strengths, treatment efficacy (if applicable) • Disadvantages • So much land, so little wind tunnel • Labor intensive (4-8 hours per measurement) • Finite length can deplete erodible portion • Despite scaling compliance, ability to quantify saltation effect questionable • Addition of “external” sand source results in undue sandblasting • Can only examine subsets of landscape, soil conditions, wind strengths, treatment efficacy (if applicable)
PI-SWERL • Portable In-Situ Wind ERosion Lab (PI-SWERL) • Like a wind tunnel • But not • Does not comply with scaling laws • Motivated by need for portable measure of wind erodibility where wind tunnels are not practical
Concept • Use flat plate to generate shear stress • Use circular shape to get steady conditions (axisymmetric flow)
Current version Miniature PI-SWERL (MPS-2) • 30 cm diameter • Rotates up to 6000 RPM or approximately u*=1 m/s or WS 60 mph • Use DustTrak (8520 or 8530) to estimate PM10 concentrations • Uses optical gate sensors to detect and quantify sand motion (not quite sand flux) • “clean” air is pumped into chamber • “dirty” air is exhausted • Emissions potential can be estimated at varying shear stresses
Confounding factors 1 • Wind tunnel measurements are point-in-time measurements. Do not account for: • Soil moisture • Temperature • Soil crusting • Disturbance level • Need to account for these • Robust measurement plan • Corrections after the fact
Confounding Factors 2 • Surface cover • WT is placed over bare or light vegetation • PI-SWERL only on very light vegetation • Both directly include accounting for gravel • Vegetation + large scale roughness – trickier • Techniques available (e.g., Raupach ,1992) • Imperfect Raupach, M.R. 1992. Drag and drag partitioning on rough surfaces. Boundary-Layer Meteorology 60(4):375-395.