Download

1 / 2
20 likes | 54 Vues
Learn how Parallel Factor Analysis (PARAFAC) can enhance the interpretation of event-related EEG signals transformed through wavelet analysis, allowing for better feature extraction and data exploration.

E N D
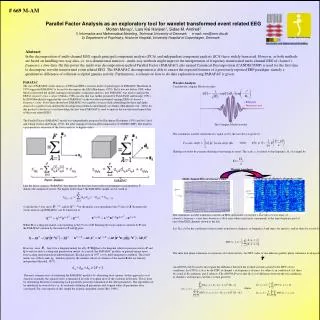
# 669 M-AM Parallel Factor Analysis as an exploratory tool for wavelet transformed event related EEG Morten Mørup1, Lars Kai Hansen1, Sidse M. Arnfred2 1) Informatics and Mathematical Modeling, Technical University of Denmark e-mail: mm@imm.dtu.dk 2) Department of Psychiatry, Hvidovre Hospital, University Hospital of Copenhagen, Denmark. Intelligent Signal Processing Abstract In the decomposition of multi-channel EEG signals principal component analysis (PCA) and independent component analysis (ICA) have widely been used. However, as both methods are based on handling two-way data, i.e. two-dimensional matrices - multi-way methods might improve the interpretation of frequency transformed multi-channel EEG of channel x frequency x time data. On this poster the multi-way decomposition method Parallel Factor (PARAFAC) also named Canonical Decomposition (CANDECOMP) is used for the first time to decompose wavelet transformed event related EEG. The PARAFAC decomposition is able to extract the expected features of a previously reported ERP paradigm: namely a quantitative difference of coherent occipital gamma activity. Furthermore, a scheme on how to do data exploration using PARAFAC is given. PARAFAC The use of PARAFAC in the analysis of EEG and ERP is not new. In his original paper on PARAFAC Harshman in 1970 suggested PARAFAC to be used to decompose the EEG (Harshman, 1970). But it was not before 1988, when Möcks reinvented the model, naming it topographic component analysis, that PARAFAC was used to analyze the ERP of channel x time x subject (Möcks, 1988) an idea that was further pursued by Field (Field and Graupe, 1991). In 2004 Miwakeichi suggested the use of PARAFAC on the wavelet transformed ongoing EEG of channel x frequency x time. It was here shown how PARAFAC was capable of successfully identifying the theta and alpha atoms of a cognitive task and that the decomposition method could identify eye blinks (Miwakeichi et al., 2004). In this poster it is however to our knowledge the first time PARAFAC is used to analyze the wavelet transformed data of the event related EEG. Wavelet Analysis Consider the complex Morlet wavelet: - Real part - Imaginary part The Parallel Factor (PARAFAC) model was independently proposed by Harshman (Harshman, 1970) and by Carrol and Chang (Carrol and Chang, 1970), the latter naming it Canonical Decomposition (CANDECOMP). The model is a parsimonious extension of the factor analysis to higher orders The Complex Morlet wavelet The continuous wavelet transform of a signal x(t) by the wavelet is given by: where Shifting a wavelet by p means delaying or hastening its onset. The scale, a, is related to the frequency, , of a signal by: Wavelet transform 3-way array of channel x frequency x time Multi channel EEG of channel x time Like the factor analysis, PARAFAC decomposes the data into factor effects pertaining to each modality. F denotes the number of factors. For higher orders than 3 the PARAFAC model can be stated as: channel channel frequency time time Consider the 3-way array XI x J x K, and let XI x j x K be the matrix corresponding to the jth slice of X. In matrix the factor analysis and PARAFAC can be expressed as: The continuous wavelet transform converts an EEG-data matrix of channel x time into a 3-way array of channel x frequency x time here shown as a 16x4 array where each array corresponds to the time-frequency plot of one of the EEG channels shown to the left. Where Dj is a diagonal matrix corresponding to the jth row of D. Rotating the factor analysis solution by P and the PARAFAC solution by the matrices P and Q gives: Let Xe(c,f,t) be the coefficient of the wavelet transform at channel c at frequency f and time t for epoch e, and let there be a total of n epochs.In the following the measure of interest (MOI) is the inter trial phase coherence (ITPC) also named the phase locking factor: However, since has to be a diagonal matrix for all j, P-1DjQ has to be diagonal which in practise restricts P and Q to only be each a scaling and permutation matrix. As a result, the PARAFAC model is in general unique apart from scaling and permutation indeterminacies. Kruskal gave in 1977 a very mild uniqueness condition. The result makes use of the k-rank, kB, which is given by the smallest subset of columns of the matrix B that are linearly independent (Kruskal, 1977): The inter trial phase coherence is a measure of evoked activity. An ITPC value of one indicates perfect phase coherence in all epochs, while random noise on the average have coherence of (Nunez et al., 1997). An ANOVA will be used to investigate the difference between the evoked activities given by the ITPC of two conditions. Let ITPC(c,f,t,k,s) be the ITPC at channel c at frequency f at time t for subject s in condition k. Let there be a total of K conditions and S subjects. The ANOVA F-test value Z(c,f,t) of difference between the two conditions at channel c at frequency f at time t is then given by: The most common way of estimating the PARAFAC model is by alternating least squares. In this approach a cost function (normally the squared error) is minimized in order to explain most of the variation in the data. This is done by alternating between re-estimating each parameter given the estimation of the other parameters. The algorithm can be initialized in several ways i.e. by randomly defining all parameters and stopped when all parameters have converged. For a description of this simple but popular algorithm confer (Bro, 1998). where
Ob Nob Flow chart of the analysis. The ERP was wavelet transformed using a complex Morlet wavelet with center frequency c=1 and bandwidth parameter b=2. The measure of interest (MOI) i.e. the ITPC was calculated for each subject under each condition and a 3-way array of the ANOVA F-test value calculated. The F-test array was analyzed using PARAFAC and the region of interest (ROI, here in the time-frequency domain) of most difference between the two conditions identified. The ITPC in the ROI was then analyzed using PARAFAC on the 5-way array given by channel x frequency x time x subject x condition of ITPC values. Finally, the ITPC of the ROI of each subject under each condition given by the 3-way array of channel x frequency x time was also analyzed by PARAFAC and the individual peaks of the ITPC identified for each subject under each condition. The grand average of the topographies corresponding to the individual peak time and frequency for each condition of each subject is shown to the left of the above figure, illustrating that the peak frequency/moment evoked activity is attenuated in the Nob condition. To the right the grand average ERP of the 11 subjects for the two conditions (Ob blue, Nob red) of channel O2 is given. • Discussion • From the PARAFAC analysis of the ANOVA F-test values it is evident that the difference between the Ob and Nob condition is in the gamma band of the occipital region around 100 ms as expected by the paradigm. It seems as if the explorative application of PARAFAC on the ANOVA F-test values can give a solid idea if and where in the three-dimensional array a region of difference between conditions are present. • The PARAFAC decomposition of the 5-way array of ITPC values reveals both quantitative and qualitative effects. Furthermore, the main effect is as expected the quantitative difference between Ob and Nob. Consequently, the 5-way PARAFAC endorse novel and easy applicable comprehensive view of data, which has not previously been seen. • The PARAFAC decomposition plot of the ITPC of each individual subject in each condition enables easy read off; a procedure which here enables the construction of a cross modality grand average topography again substantiating the previously reported condition difference. • In this poster evoked activity was of interest, consequently the measure of interest (MOI) was the ITPC. Yet the PARAFAC is expected to perform just as successful on other MOI. As a result, the presented flow chart is considered applicable to a wide range of analyses of the wavelet transformed event related EEG. • PARAFAC might become an important tool in the analysis of a wide range of brain data. The scheme developed here is obviously applicable also to MEG data, and we think it is worthwhile to mention that PARAFAC has previously been applied to fMRI (Beckmann et al., 2005). Consequently, great potentials lie ahead in terms of the analysis of brain data using PARAFAC. Experimental details The stimulus paradigm has been described in detail previously (Herrmann et al., 2004). Briefly it consists of two types of black and white drawings: 1. Objects (Ob), which are easily recognizable every-day type of objects like a chair, a number or a pipe, and 2. Non-objects (Nob), which are chaotic re-arrangements of the Ob drawings. The expected feature was bilateral coherent occipital gamma activity around 100 ms in the occipital region attenuated in the Nob condition. Results The 3-way array analysis of the ANOVA test values Z(c,f,t) of difference between the ITPC of the Ob and Nob conditions taken over the 11 subjects yielded a good fit in a one component PARAFAC model. As seen on the figure above, it is evident that the main difference in the evoked activity is in the gamma band between 40 and 80 Hz around 100 ms. Following this indication of region of interest (ROI) subsequent analyses were performed in a narrower frequency and latency window (Frequency 30-80 Hz; Time 0-200ms); the number of channels were not restricted. Hz ms Condition Hz ms Subject Hz ms Presently, we work on applying PARAFAC to other paradigms. The figure above shows the result of a PARAFAC analysis of the ITPC of a subject that during even conditions had his right hand pulled and during odd the left hand. The analysis was here performed to yield time-frequency plots. Consequently, the analyzed multi-way had the form channel x time-frequency x condition. From the PARAFAC analysis clear evoked gamma activity around 60 ms and 40 Hz is seen in the parietal right region during stimulation of left hand (odd conditions) whereas the parietal left region was stimulated primarily during even conditions where right hand was pulled. ms Subject Condition Hz The ITPC 5-way array ITPC(c,f,t,s,k) of channel x frequency x time x subject x condition, shown to the left of the above figure, could only entail a two component PARAFAC model. As seen to the right, the first component encompassed occipital activity at app. 30 Hz and 100 ms. This first component was present in both conditions, but it was as expected attenuated in the Nob condition (condition 2). The activity was present in all subjects, but it was not strong in subjects 3, 4 and 5. The second component was localized more frontally and it was of a higher frequency, while peak latency was similar to the first component. This second component was almost totally limited to the Nob condition. The specific Nob activity was not present in subject 1,4,10 and 11. Where the first factor indicates a quantitative difference between conditions, the second indicates a qualitative. First factor accounts for 11.2 % of the total variation whereas the second factor only explains 3.6 %. Conclusion PARAFAC decomposition is a promising data exploratory tool in the analysis of the wavelets transformed event related EEG. The method is able to extract the expected features of a previously reported ERP paradigm also incorporating subject and condition modalities. The PARAFAC decomposition of the 3-way array of ANOVA F-test values clearly shows the difference region of interest across modalities, while the 5-way ITPC analysis enables visualization of both quantitative and qualitative differences. Furthermore, PARAFAC can be used to analyze each subjects channel x time x frequency or analyze a subject through conditions also incorporating time-frequency plots. References Beckmann, C. F., Smith, S. M., 2005. Tensorial extensions of independent component analysis for multisubject FMRI analysis, NeuroImage 25 294– 311 Bro, R., 1998. Multi-way Analysis in the Food Industry: Models, Algorithms and Applications.). University of Amsterdam (NL) and Royal Vereinary and Agricultural University (DK), Amsterdam/Copenhagen. Bro, R. and Jong, S. D., 1997. A fast non-negativity-constrained least squares algorithm. Journal of Chemometrics. 11, 393-401. Carrol, J. D. and Chang, J., 1970. Analysis of individual differences in multidimensional scaling via an N.way generalization of 'Eckart-Young' decomposition. Psychometrika. 35, 283-319. Field, A. S. and Graupe, D., 1991. Topographic component (parallel factor) analysis of multichannel evoked potentials: practical issues in trilinear spatiotemporal decomposition. Brain Topogr. 3, 407-423. Harshman, R. A., 1970. Foundation of the PARAFAC procedure: models and conditions for an 'explanatory' multi-modal factor analysis. UCLA Work Pap Phon. 16, 1-84. Herrmann, C. S., Lenz, D., Junge, S., Busch, N. A. and Maess, B., 2004. Memory-matches evoke human gamma-responses. BMC Neurosci. 5, 13. Herrmann, C. S., Mecklinger, A. and Pfeifer, E., 1999. Gamma responses and ERPs in a visual classification task. Clin Neurophysiol. 110, 636-642. Kruskal, J. B., 1977. Three-way arrays: rank and uniqueness of trilinear decompositions, with application to arithmetic complexity and statistics. Linear Algebra Appl. 18, 95-138. Lachaux, J. P., George, N., Tallon-Baudry, C., Martinerie, J., Hugueville, L., Minotti, L., Kahane, P. and Renault, B., 2005. The many faces of the gamma band response to complex visual stimuli. Neuroimage. 25, 491-501. Miwakeichi, F., Martinez-Montes, E., Valdes-Sosa, P. A., Nishiyama, N., Mizuhara, H. and Yamaguchi, Y., 2004. Decomposing EEG data into space-time-frequency components using Parallel Factor Analysis. Neuroimage. 22, 1035-1045. Mocks, J., 1988. Decomposing event-related potentials: a new topographic components model. Biol Psychol. 26, 199-215. Nunez, P. L., Srinivasan, R., Westdorp, A. F., Wijesinghe, R. S., Tucker, D. M., Silberstein, R. B. and Cadusch, P. J., 1997. EEG coherency. I: Statistics, reference electrode, volume conduction, Laplacians, cortical imaging, and interpretation at multiple scales. Electroencephalogr Clin Neurophysiol. 103, 499-515. Sidiropoulos, N. D. and Bro, R., 2000. On the uniqueness of multilinear decomposition of N-way arrays. J Chemometrics. 14, 229-239. Smilde, A., Bro, R. and Geladi, P., 2004. Multi-way Analysis: Applications in the Chemical Sciences. Tallon-Baudry, C. and Bertrand, O., 1999. Oscillatory gamma activity in humans and its role in object representation. Trends Cogn Sci. 3, 151-162. Todorovska, M. I., 2001. Estimation of Instantaneous Signals Using the Continuous Wavelet Transform. Department of Civil Engineering, University of Southern California. When the ITPC was decomposed in each condition of every subject (a 3-way array of channel x frequency x time), a one component PARAFAC model yielded a good fit. This resulted in 22 decomposition plots of a subjects ITPC given by channel x frequency x time. The figure above shows the Ob condition of subject 6. In these decomposition plots the time and frequency point of the peak of the gamma activity was visually identified. In four plots it was not possible to identify a peak. Here the peaks were defined at 40 Hz and 100 ms. In some subjects, more than one peak was found in the frequency signature. Here the peak of highest frequency was chosen. The ITPC topography corresponding to the individual peak time and frequency was obtained.