Download
1 / 81
810 likes | 1.06k Vues
ECONOMICS. What does it mean to me?. Part III: The Production Possibility Curve Comparative Advantage. Resources (Factors of Production) include: 1) Land , includes all NATURAL RESOURCES coming from the earth,

E N D
ECONOMICS What does it mean to me? • Part III: • The Production Possibility Curve • Comparative Advantage
Resources (Factors of Production) include: 1) Land, includes all NATURAL RESOURCES coming from the earth, 2) Labor, includes the total of both physical and mental effort expended by people….also called HUMAN RESOURCES, 3) Capital, includes all HUMAN-MADE RESOURCES used to produce final goods, and services. 4) Entrepreneurship, includes the person making tough, risky decisions about how to combine land, labor, and capital together.
CIRCULAR FLOW OF INCOME $$$$$$ GOODS Product Market HOUSEHOLDS FIRMS CAPITAL, LAND, LABOR INTEREST, PROFIT, WAGES, RENT Factor Market
Figure 1 The Circular Flow Mankiw
There are 4 economic systems: 1) Traditional 2) Market 3) Command 4) Mixed Exists in very few parts of the world. Based on custom and tribal law. Government does not intervene in the freely chosen activity between buyers and sellers. Also called free enterprise and capitalism. Government controls all the factors of production. Also called communism. Contains characteristics of the market and command systems. Also called socialism.
ADAM SMITH, the founder of capitalism believed in a concept of laizze-faire economics…..also called the Invisible Hand Theory. He believed that government should never interfere in the decisions of the market place.
On a scale, the command economy goes to the left and the market economy goes to the right. Pure market, free enterprise or Capitalist Mixed or Socialist Command or Communist TOTAL government control NO government control Almost all economies in the world fall somewhere on this line between total and no government control.
Is the United States a Pure Market Economy?? Pure market, free enterprise or Capitalist Mixed or Socialist Command or Communist TOTAL government control NO government control No. The U.S. would probably fall here on this scale regarding the amount of government control over business. The INTERSTATE COMMERCE COMMISSION (ICC) is an example of a regulatory agency in the U.S. who controls the affairs of business.
ALL societies much answer the five basic economic questions: 1) What and how much to produce? 2) How should goods and services be produced? 3) Who should share in what is produced? 4) Who should produce what? 5) How should we use our scarce resources efficiently? How are each of these questions answered in Capitalist, Socialist, and Communist economies?
The Characteristics of the Pure Market Economy: Little or no government control Freedom of enterprise Freedom of choice Private property Profit incentive Competition
Characteristics of a Command Economy: Government controls all the Factors of Production. Limited, controlled education 3) Individuals have little, if any, influence over how the basic economic questions are answered.
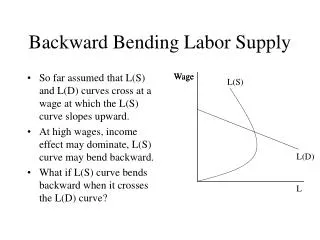
Production Possibility Curves represent the TRADE-OFFS between resources involved when scarcity occurs in the economy.
Because societies must CHOOSE between alternatives, economists use a PRODUCTION POSSIBILITIES table to list the different combinations of two products that can be produced with a specific set of resources.
The area along the curve represents MAXIMUM production. Guns For example: 200 150 125 100 75 50 25 0 Let’s compare two markets: Guns and Butter. 25 50 75 100 125 150 200 Butter
The area along the curve represents MAXIMUM production. 200 guns, 0 butter Guns 200 150 125 100 75 50 25 0 0 guns, 200 butter 25 50 75 100 125 150 200 Butter
Given the resources available, if maximum production is equal to 200 units, then Guns For example: 200 150 125 100 75 50 25 0 Point A represents maximum production of 125 Guns and A 75 pounds of Butter. 125+ 75 = 200 25 50 75 100 125 150 200 Butter
Given the resources available, if maximum production is equal to 200 units, then Guns For example: 200 150 125 100 75 50 25 0 Point B represents maximum production of 75 Guns and A B 125 pounds of Butter. 125+ 75 = 200 25 50 75 100 125 150 200 Butter
Given the resources available, if maximum production is equal to 200 units, then Guns For example: 200 150 125 100 75 50 25 0 Point C represents underproduction of 50 Guns and A 75 pounds of Butter. B C 50 + 75 =125 This point underproduces by 75 units 25 50 75 100 125 150 200 Butter
Given the resources available, if maximum production is equal to 200 units, then Guns For example: Point D represents impossible production of 150 Guns and 200 150 125 100 75 50 25 0 D A 150 pounds of Butter. B C 150 + 150 = 300 This point is impossible to produce. 25 50 75 100 125 150 200 Butter
Any point along the curve represents the TRADE-OFFS. Guns D 150 125 100 75 50 25 0 A Any point along the curve is a point of MAXIMUM PRODUCTION. B C 25 50 75 100 125 150 Butter
The point along the curve represent the TRADE-OFFS. Republican Agenda D 150 125 100 75 50 25 0 A For instance, the trade-off could be between the Republican Agenda and the Democratic Agenda. B C 25 50 75 100 125 150 Democratic Agenda
The point along the curve represent the TRADE-OFFS. Environmental Goods D 150 125 100 75 50 25 0 A The trade-off could be between protecting the environment and the production of goods people perceive as necessary for everyday living. B C 25 50 75 100 125 150 Ordinary Goods
Whether a country is rich or poor, the trade-offs are equally difficult.
EVERYTHING in life involves trade-offs. Sleep Corn Guns Work Single D 150 125 100 75 50 25 0 A B C 25 50 75 100 125 150 Married Play Soy Beans School Butter
Point C represents inefficiency. Guns D 150 125 100 75 50 25 0 Point C = Could have more of everything but has HIGH UNEMPLOYMENT. (recession, depression) A B C 25 50 75 100 125 150 Butter
Figure 3 A Shift in the Production Possibilities Frontier *Mankiw
Recession: when a negative GDP exists for at least 3 months. Depression: when a negative GDP exists for at least 6 months. In a recession or depression, the flow of goods and services get smaller.
Microeconomics assumes FULL employment at all times. However, full employment equals 5% unemployment.
SO…..who decides whether we should be at point A or point B?? Guns D 150 125 100 75 50 25 0 A Government? Leader? Vote? The market? B C 25 50 75 100 125 150 Butter
Remember Point A: Given the resources available, if maximum production is equal to 200 units, then Guns Point A represents maximum production of 125 Guns and 75 pounds of Butter. 200 150 125 100 75 50 25 0 A 125+ 75 = 200 25 50 75 100 125 150 200 Butter
Assuming we are at point A, let’s take a look at separate charts for: GUNS BUTTER P R I C E P R I C E QUANTITY QUANTITY 125 75 Are we worse off by having too many guns? Will social programs suffer by having too little butter?
Each point on the production possibilities curve represents some maximum output of the two products. The curve is a production frontier because it shows the limit of attainable outputs. To obtain the various combinations that fall on the PP curve, society must achieve BOTH full employment and productive efficiency. A B ROBOTS 9 8 7 6 5 4 3 2 1 C D E (1000s) 0 1 2 3 4 5 6 7 8 9 10 PIZZAs (100,000s)
The amount of other products which must be forgone or sacrificed to obtain 1 more unit of a specific good is called the OPPORTUNITY COST of that good. In moving from alternative A to B, we find that the cost of 1 additional pizza is 1 less unit of robot. A B ROBOTS 9 8 7 6 5 4 3 2 1 C D E (1000s) 0 1 2 3 4 5 6 7 8 9 10 PIZZAs (100,000s)
But as we pursue the concept of cost through the additional production possibilities--B to C, C to D, D to E--an important economic concept is revealed. The opportunity cost of each additional pizza is greater than that of the previous one. Going from B to C sacrifices 2 additional units of robots for 1 unit of pizza. A B ROBOTS 9 8 7 6 5 4 3 2 1 C D E (1000s) 0 1 2 3 4 5 6 7 8 9 10 PIZZAs (100,000s)
Conversely, you should realize that as we move from E to A, the cost of an additional robot is 1/4, 1/3, 1/2, and 1 unit of pizza. TWO POINTS: 1)Costs are measured in real terms--actual goods rather than money. 2)We are discussing marginal, rather than cumulative or total opportunity costs. A B ROBOTS 9 8 7 6 5 4 3 2 1 C D E (1000s) 0 1 2 3 4 5 6 7 8 9 10 PIZZAs (100,000s)
A 2)(cont) For example, the marginal opportunity cost of the third unit of pizza is 3 robots. B ROBOTS 9 8 7 6 5 4 3 2 1 C D But the TOTAL opportunity cost of 3 units of pizza is 6 units of robots. E (1000s) 0 1 2 3 4 5 6 7 8 9 10 PIZZAs (100,000s)
The Law of Increasing Opportunity Costs states: The more of a product that is produced, the greater its’ opportunity cost. (“marginal” being implied) This law is reflected in the shape of the production possibilities curve. As you can see, as the economy moves from A to E, it must give up successively larger amounts of robots to acquire equal increments of pizza. This is evidenced in the slope of the curve which becomes steeper as we move from A to E. A B ROBOTS 9 8 7 6 5 4 3 2 1 C D E (1000s) 0 1 2 3 4 5 6 7 8 9 10 PIZZAs (100,000s)
The economic rationale for the law of increasing opportunity cost is that economic resources are not completely adaptable to alternative uses. The lack of perfect flexibility on the part of resources is the cause of increasing opportunity costs. A B ROBOTS 9 8 7 6 5 4 3 2 1 C D E (1000s) 0 1 2 3 4 5 6 7 8 9 10 PIZZAs (100,000s)
ALLOCATIVE EFFICIENCY requires that the economy produce at the most optimal point on the production possibilities curve. Any economic activity should be expanded as long as marginal benefits (MB) exceed marginal costs (MC) and should be reduced if marginal costs are greater than marginal benefits. MC MB & MC The optimal amount occurs where MB = MC. MB Quantity of Pizza (hundreds of thousands)
Any point inside the production possibilities curve indicates unemployment and productive inefficiency. It means it COULD produce more of one or both products than it is producing at point U. ROBOTS 9 8 7 6 5 4 3 2 1 U (1000s) 0 1 2 3 4 5 6 7 8 9 10 PIZZAs (100,000s)
A When ECONOMIC GROWTH occurs, the production possibilities curve will shift rightward allowing the economy to have larger quantities of both types of goods. 121110 9 8 7 6 5 4 3 2 1 B ROBOTS C D This is the result of: 1) increases in supply of resources, 2) improvements in resource quality, or 3) technological advances. E (1000s) 0 1 2 3 4 5 6 7 8 9 10 11 12 PIZZAs (100,000s)
A 121110 9 8 7 6 5 4 3 2 1 The Production Possibilities Curve can also shift right when International Specialization and Trade exist. B ROBOTS C D Specialization and trade enable a nation to get more of a desired good at less sacrifice of some other good. E (1000s) 0 1 2 3 4 5 6 7 8 9 10 11 12 PIZZAs (100,000s)
Possible Applications of Production Possibility Analysis: 1) Wartime production 2) Discrimination 3) Land-use controversies 4) Destruction from war 5) National growth 6) Famine in Africa 7) Emerging technologies
1) Natural Disasters In December 2004, the world’s strongest earthquake in 40 years shook the region near the Indonesian archipelago, creating a tsunami wave which killed nearly 200,000 people on three continents, and devastation of resources not counted as yet. P Q This caused the production possibilities curve to shift inward indicating the reduced ability to produce goods and services.
2) Discrimination Discrimination based on race, gender, age, sexual orientation or ethnic background impedes the efficient employment of human resources. P U Q Elimination of discrimination would help move the economy from some point inside the production possibilities curve toward a point on the curve.
2) Wartime production In the beginning of World War II, the U.S. had considerable unemployment. By quickly employing idle resources, the U.S. economy was able to produce more. P U Q Guns By contrast, the Soviet Union entered the war at capacity production. Their situation required considerable shifting of resources and the standard of living dropped. P Q Butter
3) Land-use controversies The tradeoffs portrayed in the production possibilities curve are part of many controversies relating to alternative uses of publicly owned land. One example is the conflict between the lumber industry in the Pacific Northwest and the environmentalists trying to save the spotted wood owl. Lumber Increasing lumber production limits the owls habitat needed for survival. Maintaining the environment for the owl destroys thousands of jobs in the lumber industry. P Q Owls
The Production Possibilities Curve shows CHOICE and OPPORTUNITY COST. All choices have costs. What does it cost you to make a choice?