Logic Models Research Planning and Evaluation
Logic Models Research Planning and Evaluation. Logic Vs. Model. LOGIC the principles of reasoning reasonable the relationship of elements to each other and a whole MODEL small object representing another, often larger object (represents reality, isn’t reality)

Logic Models Research Planning and Evaluation
E N D
Presentation Transcript
Logic Vs. Model LOGIC • the principles of reasoning • reasonable • the relationship of elements to each other and a whole MODEL • small object representing another, often larger object (represents reality, isn’t reality) • preliminary pattern serving as a plan • tentative description of a system or theory that accounts for all its known properties
What are logic models? • A road map • Where are you going? • How will you get there? • What will show that you’ve arrived?
Logic Models • A visual depiction of a program or project showing what it will do and what it will accomplish • A series of “if-then” relationships that should lead to the desired outcomes • The core of program planning, evaluation, and research
Theory of Change • How and why a program or set of activities will lead to short and long-term outcomes over a specified period of time • A sequential flow of information that shows what you intend to accomplish • What are you trying to change, why you are trying to change it, how you will change it, and what will happen as a result of the change
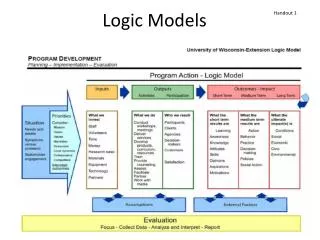
Logic Models in the Simplest Form INPUTS OUTPUTS OUTCOMES
Assumptions The beliefs we have about the problem, the program, the participants, and how it will all work together. • The problem or existing situation • Program operations • Expected outcomes and benefits • The participants and how they learn, behave, their motivations • Resources • Staff/partners • Influences from the external environment • The knowledge base of participants and partners
An Example…Headaches H E A D A C H E Getpills Takepills Feel better Situation INPUTS OUTPUTS OUTCOMES University of Wisconsin-Extension, Program Development and Evaluation
Every day logic model – Family Vacation Family Members Drive to state park Family members learn about each other; family bonds; family has a good time Budget Set up camp Car Cook, play, talk, laugh, hike Camping Equipment OUTPUTS OUTCOMES INPUTS University of Wisconsin-Extension, Program Development and Evaluation
What does a logic model look like? • Graphic display of boxes and arrows; vertical or horizontal • Relationships, linkages • Any shape possible • Circular, dynamic • Cultural adaptations; storyboards • Level of detail • Simple • Complex • Multiple models • Multi-level programs • Multi-component programs University of Wisconsin-Extension, Program Development and Evaluation
Why bother? What’s in it for you? “This seems like a lot of work.” “Where in the world would I get all the information to put in a logic model? “I’m a right brain type of person – this isn’t for me.” “Even if we created one, what would we do with it?”
Benefits of Logic Models • Differentiates between “what we are doing” and “results” • Increases understanding about the problem and the way it will be solved • Guides and helps focus work • Improved planning and management • Increases intentionality and purpose • Prevents duplication of activities, partners, data collection • Helps ensure measurement of variables • Supports replication, efficacy study • Very often a requirement, particularly in grant writing
Limitations of Logic Models • Not a theory • Intentions-not reality • Focuses on expected outcomes • Challenge of causal attribution • Many factors influence process and outcomes • External environmental factors • Doesn’t address an important question: Are we doing the right thing?
Key Components of a Logic Model • Needs/Gaps • Goals • Objectives • Activities • Partners • Process Measures • Indicators
Need • The reason for the service, program, activity, or intervention. The existing problem and evidence of the problem.
Goal • How will you address the need
Objective • Created from the goals • Adds a time-frame and the specific level of change desired
Resources/Activities • How and when you are going to accomplish your goals and objectives, both short term (present year) and long term (succeeding years) • What do you need to be successful? • Inputs
Partners • Those people involved in making this project successful. Specifying who is performing the activity aligned with the objective and when it will be performed is necessary in setting the groundwork for accountability and evaluation.
Process Measure • What will be provided to assure that the activities are being accomplished? • The process measures were developed with the activity partners to ensure that data collection would be feasible and appropriate to the goals and objectives of the program.
Indicators • The culmination of all subsequent columns, with the addition of how you are going to measure or evaluate the impact of the project. • How will you know it when you see it? • What will be the evidence? • What are the specific indicators that will be measured?
Typical activity indicators to track • Amount of products, services delivered • #/type of customers/clients served • Timeliness of service provision • Accessibility and convenience of service • Location; hours of operation; staff availability • Accuracy, adequacy, relevance of assistance • Courteousness • Customer satisfaction
Methods of data collection SOURCES OF INFORMATION • Existing data • Program records, attendance logs, etc • Pictures, charts, maps, pictorial records • Program participants • Others: key informants, nonparticipants, proponents, critics, staff, collaborators, funders, etc. DATA COLLECTION METHODS • Survey • Interview • Test • Observation • Group techniques • Case study • Photography • Document review • Expert or peer review
Check your logic model • Is it meaningful? • Does it make sense? • Is it doable? • Can it be verified?
References • Chen, H.T. (1990). Theory-driven evaluations. Newbury Park, CA: Sage. • Hernandez, M. (2000). Using logic models and program theory to build outcome accountability. Education and Treatment of Children, 23(1), 24-40. • Koskin, J.A. (1997). Office of Management and Budget Testimony Before the House Committee on Government Reform and Oversight Hearing. February 12. • Safe Schools/Healthy Students. (n.d.). Retrieved February 1, 2007, from http://www.sshs.samhsa.gov/ • Weiss, C. H. (1998). Have we learned anything new about the use of evaluation? American Journal of Evaluation, 19(1), 21-34. • University of Wisconsin Cooperative Extension Service