Logic Models: A framework for program planning and evaluation
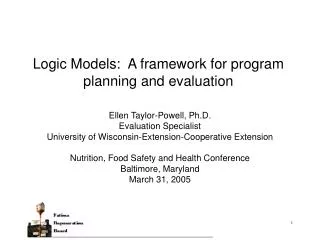
Logic Models: A framework for program planning and evaluation. Ellen Taylor-Powell, Ph.D. Evaluation Specialist University of Wisconsin-Extension-Cooperative Extension Nutrition, Food Safety and Health Conference Baltimore, Maryland March 31, 2005. A bit of history. Dates to late 1960’s

Logic Models: A framework for program planning and evaluation
E N D
Presentation Transcript
Logic Models: A framework for program planning and evaluation Ellen Taylor-Powell, Ph.D. Evaluation Specialist University of Wisconsin-Extension-Cooperative Extension Nutrition, Food Safety and Health Conference Baltimore, Maryland March 31, 2005
A bit of history Dates to late 1960’s Current accountability demands • Public Sector - GPRA • Non-Profit Sector • Private Sector • International Agencies • Evaluation
Accountability era • What gets measured gets done • If you don’t measure results, you can’t tell success from failure • If you can’t see success, you can’t reward it • If you can’t reward success, you’re probably rewarding failure • If you can’t see success, you can’t learn from it • If you can’t recognize failure, you can’t correct it. • If you can demonstrate results, you can win public support. Osborne and Gaebler, 1992
» » » » Inputs Outputs Outcomes Outcomes Outcomes Activities Participation » » » » Inputs Activities Outputs Outcomes Outcomes Outcomes Generic logic model Strategy Results » C O N T E X T A diagram of the theory of how a program is supposed to work A graphic depiction of relationships between activities and results
Simple logic model SITUATION: During a county needs assessment, majority of parents reported that they were having difficulty parenting and felt stressed as a result OUTCOMES INPUTS OUTPUTS Parents increase knowledge of child dev Parents identify appropriate actions to take Develop parent ed curriculum Staff Improved child-parent relations Targeted parents attend Parents better understanding their own parenting style Money Deliver series of interactivesessions Parents use effective parenting practices Strong families Partners Parents gain skills in effective parenting practices Facilitate support groups Research
Logic model of a training workshop Situation: Funder requires grantees to include a logic model in their funding request; grantees have limited understanding of logic models and are unable to fulfill the funding requirement OUTCOMES INPUTS OUTPUTS Increase knowledge of logic models Increase ability to create a useful logic model of program Increase confidence in using logic models Fulfill requirement of funder Create meaningful logic models Use logic models in own work • 3 hour training • Interactive activities • Group work • Practice • Q and A Trainer Funds Equipment Research base Training curriculum Grantees Improved planning Improved evaluation Accountable here
Programs are not linear! INPUTS OUTPUTS OUTCOMES Activities Participation Short Medium Long-term Program investments What we invest What we do Who we reach What results
Language: What do you mean by… • Goal = Impact • Impact = Long-term outcome • Objectives (participant focused) = Outcomes • Activities = Outputs • Outputs may signify “tangible” accomplishments as a result of activities
What does a logic model look like? • Graphic display of boxes and arrows; vertical or horizontal • Relationships, linkages • Any shape possible • Circular, dynamic • Cultural adaptations; storyboards • Level of detail • Simple • Complex • Multiple models
So, why bother? What’s in this for you? “This seems like a lot of work.” “Where in the world would I get all the information to put in a logic model? “I’m a right brain type of person – this isn’t for me.” “Even if we created one, what would we do with it?”
What we are finding: • Provides a common language • Helps us differentiate between “what we do” and “results” --- outcomes • Increases understanding about program • Guides and helps focus work • Leads to improved planning and management • Increases intentionality and purpose • Provides coherence across complex tasks, diverse environments
Enhances team work • Guides prioritization and allocation of resources • Motivates staff • Helps to identify important variables to measure; use evaluation resources wisely • Increases resources, opportunities, recognition • Supports replication • Often is required!
Testimonials “Wow – so that is what my program is all about” “I’ve never seen our program on one page before” “I’m now able to say no to things; if it doesn’t fit within our logic model, I can say no. “ “I can do this” “This took time and effort but it was worth it; our team never would have gotten here otherwise.” “It helped us to think as a team – to build a team program vs. an individual program.”
Multi agency partnership: Abating ammonia emissions from dairy farms OUTPUTS OUTCOMES INPUTS Accurate research available and shared Conduct research Research inputs Res’rchers Extension inputs Disseminate & educate Producers Adopt BMPs Reductions in ammonia emissions Develop & set standards Policy inputs Policy is followed Test & feedback Producer inputs Powell et al, 2005
Multi agency partnership: Research sub-logic model Increased knowledge of sources, processes of ammonia emissions Conduct process & operational level experim’ts Scientists Accurate research available Interpret, validate results Increased skills in non-traditional science Staff Scale up/out results Res’rchers Partners Equipm’t • Research widely communi-cated • Publication • Popular press • Pres’tations • Reports Reductions in ammonia emissions Increased ability to determine ammonia emissions at different scales Incorporate farmer feedback Funding Educate re. complexities, components, opportunities Existing knwl’dge Increased understanding of relationship between measurement and actual emissions Generate funding Powell et al, 2005
Benefits of logic modeling to this partnership • Provided framework to discuss and articulate joint work • Helped facilitate conversation with focus on agreed upon goal that might not happened otherwise • Shows contribution of each partner and how result depends upon all • Keeps end outcome upfront and center • Provides way to communicate about the partnership that has been presented at national conference • Separates indicators of achievement - # papers published, # and type of experiments completed – from theory of change. Indicators of achievement are part of evaluation plan for the partnership.
Tobacco Control: Global View Community programs Chronic disease pr’grms Research: evidence-base Change in knowledge, attitudes, skills, motivation Policy makers Current and potential users Disparate populations Key stakeh’ders Publics Policy change School programs Decreased smoking Enforcement Policy Statewide programs System change Reduced exposure to ETS Practitioners Change in support Counter-marketing Advocates Individual change Cessation programs Change in access Funders Reduce mortality, morbidity Evaluation and Surveillance Partners Administration & management
Tobacco Control: Statewide View - Community Program • Policy makers • Current and potential users • Disparate populations • Key stakeh’ders Promote smoke-free policy change Demon-strations of support Change in K,A,S,M Research: evidence-base Decreased smoking Policy Reduced exposure to ETS Prevent youth initiation, reduce use Change in support Policies impl’mentedenforced Practitioner Advocates Change in access Reduce mortality, morbidity Treat tobacco addiction Individual change Partners Funders • Coalition members • Key stakeh’ders • Change in • KAS, • Self-efficacy, • Intent Effective coalition functioning Success-ful TC imple-mentation Coalition development
Tobacco Control: Local view - smoke-free environments OUTCOMES Increased awareness of importance of SF public policies Public Demonstrations of support Organize and implement SF campaign Coalition Time Money Partners including youth Research and best practices Elected officials Increased knowledge of SF benefits and options SF policies drafted, improved Form committee Develop grassroots support Educate community Organize earned media Identify and work with supportive policy makers • SF: • Municipal buildings, grounds, & vehicles • Public areas & events • Worksites • Residence Mgrs of public areas/events Increased commitment, support, demand for SF environments SF public policies implemented Worksite contacts SF public policies adhered to and enforced Residential owners, mgrs Increased knowledge and skills to participate in SF public policy change Community activists Increased availability of cessation support and services Change in intent to make services/support available Media
Logic Model and Planning • Applies at any level: national plan, statewide plan, individual plan of work, specific project/activity plan • Model vs. more detailed program plan/management plan • Focus on outcomes: “start with end in mind”
Logic model and evaluation Evaluation Needs/asset assessment: What are the characteristics, needs, priorities of target population? What are potential barriers/facilitators? What is most appropriate? Process evaluation: How is program implemented? Fidelity of implementation? Are activities delivered as intended? Are participants being reached as intended? What are participant reactions? Outcome evaluation: To what extent are desired changes occurring? For whom? Is the program making a difference? What seems to work? Not work? What are unintended outcomes?
EVALUATION: What do you (and others) want to know about this program? Parents increase knowledge of child dev Develop parent ed curriculum Parents identify appropriate actions to take Staff Targeted parents attend Improved child-parent relations Deliver series of interactivesessions Money Parents better understand their own parenting style Partners Parents use effective parenting practices Research Parents gain skills in effective parenting practices Strong families Facilitate support groups To what extent did behaviors change? For whom? Why? What else happened? To what extent are relations improved? Does this result in stronger families? What amount of $ and time were invested? How many sessions were actually delivered? How effectively? # and quality of support groups? Who/how many attended/did not attend? Did they attend all sessions? Supports groups? Were they satisfied – will they come again? To what extent did knowledge and skills increase? For whom? Why? What else happened?
What logic model is not… • A theory • Reality • An evaluation model or method It is a framework for describing the relationships between investments, activities and results. It provides a common approach for integrating planning, implementation, evaluation and reporting.
Cautions: • Time consuming - paperwork • Too much focus on outcomes • Too little focus on testing the theory • Perfecting the key to the wrong lock • Attending to context only at front end • Universal vs. context specific mechanisms • Viewing logic model as reality • “Pyrennes not the Alps”
Summing up • Demonstrates accountability with focus on outcomes • Links activities to results: Prevents mismatches • Integrates planning, implementation, evaluation and reporting • Creates understanding • Promotes learning • A way of thinking – not just a pretty graphic