Download
1 / 17
170 likes | 259 Vues
This presentation explores a forecast model for economic phenomena considering the evolving economic, social, and political environment, focusing on Romania's transition period. The methodology includes Principal Component Analysis and Fisher’s classification functions.

E N D
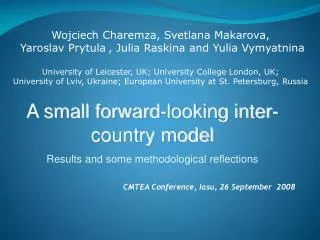
Conference on Medium Term Economic Assessment (CMTEA) 39TH Edition, Iaşi, September 25–27, 2008 PROGNOSIS USING THE MULTIVARIATE STATISTICAL ANALYSIS OF THE DYNAMICS OF A PHENOMENON Professor Elisabeta JABA, PhD Assistant Christiana Brigitte BALAN, PhD Lecturer Mariana GAGEA, PhD “Alexandru Ioan Cuza” University of Iaşi
Introduction Classical analysis Modern analysis In most studies of time series analysis, one starts from the hypothesis of linearity. This hypothesis is opposing to the evolution of the specific transition and post-transition phenomena. For such situations, we propose a forecast model that takes into consideration the economic, social and political environment in which the analyzed phenomenon develops.
The Romanian economic environment in the transition period The economic changes specific to the transition period are characterised by:1.The restructuring and privatization process that generated economic downfalls, unemployment and inflation2.The improvement of the macroeconomic output, after 2003, reflected by the positive GDP growth rate generated by the high volume of investments and private consumption The socio-demo-economic indicators follow specific evolutions: the indexes of the employment rate dynamics show a general decreasing trend the population number, after 1990, decreased constantly with negative yearly average rhythms and the change of the population dynamics by residence areas the natural increase was positive since 1992 and has become negative after that the GDP has a positive trend
Overview of the presentation 1. Data and variables 2. Methodology 2.1. Working hypothesis 2.2. The algorithm of the proposed method 3. Results 3.1. Years-cluster with respect to the dynamics of the observed phenomena using the Principal Component Analysis (PCA) 3.2. Fisher’s classification functions coefficients 3.3. The classification of the horizon 2008 in a years-cluster 3.4. The employment rate estimated for the year 2008 4. Conclusion
1. Data and variables • For expressing the employment we used the employment rate. The dynamics of the employment rate and of the influence factors (demographic and economic) is evaluated through indexes. • The observed period is 1990-2004, and the forecast horizon refers to the years 2007-2009. • The data are obtained from the official statistics [Romanian Statistical Yearbook, 1991-2005] and they were processed with the SPSS software. • The variables considered in our study are the independent variables X1, X2, …, X7, and the variable X8 (Employment rate), presented in Table 1. Table 1.The variables considered in the study
2.1. Working hypothesis • The employment rate dynamics has a specific trend defined by years-clusters with respect to the values of the dynamics indexes and the trend related to the changes made in the economic, social and political environment. • The use of a method that takes account of the specific variations, with different trend and changing trend, of the phenomena that determine the employment rate. • A trend extrapolation of the employment rate, as in the classical prognosis, for the entire period, would bring serious deviations from the normal path of evolution of the phenomena.
2.2.The algorithm of the proposed method • We propose a method of forecast of a phenomenon level based on the forecast of the its development environment. • This method takes in consideration: • the relationships between the dynamics of the influence factors and the employment rate dynamics years-clusters • the dynamics of the influence factors define the trend for the years-clusters. • The application of this method supposes an algorithm with several stages, using statistical methods of multivariate analysis.
Stage 1. We evaluate and synthesize the interrelations among the phenomena that characterize the development environment of the employment rate dynamics. • We identify years-clusters based on the interrelations between the employment rate dynamics and the influence factors dynamics, using the Principal Component Analysis (PCA). • Stage 2. We identify the years-cluster in which a specified forecast horizon is classified. • We use the Fisher’s classification functions defined by the Discriminant Analysis (DA). • The forecast horizon is classified in the years-cluster for which the Fisher’s classification function from DA gives the highest score. • The scores are computed based on the estimations of the influence factors for the forecast horizon. The estimations are obtained for the trend models we chose. • Stage 3. We estimate the parameters of the employment rate forecast model • The forecast model is defined by the trend corresponding to the years-cluster to which the forecast horizon belongs.
3. Results 3.1. Years-cluster with respect to the dynamics of the observed phenomena The years-clusters show characteristics specific to the dynamics of the analyzed phenomena.
the 1st cluster consisting of the years 1990-1992 (tend_pos) is characterized by: • a positive dynamics of the phenomena such as: the employment rate, the natural growth, the net migration and the number of external emigrants. • a negative dynamics of the GDP/inhabitant, life expectancy, death rate and unemployment rate; • the 2nd cluster made up of the years 1993-2001 (tend_ct) is characterized by: • a stationary dynamics of the analysed phenomena; • the 3rd cluster comprising the years 2002-2004 (tend_neg) is characterized by: • a positive dynamics of the GDP/inhabitant, life expectancy, death rate and unemployment rate; • a negative dynamics of the employment rate, natural growth, the net migration and the number of external emigrants; • the years 1993 and 1994 have singular values.
3.2. Fisher’s classification functions coefficients • The Fisher’s classification functions of a forecast horizon in a years-cluster characterized by a specific dynamics of the employment rate are defined as follows: • 1st cluster (tend _pos): • 2nd cluster (tend _ct): • 3rd cluster (tend _neg):
3.3. The classification of the horizon 2008 in a years-cluster • The trend model for each influence factor and the estimations of the trend model parameters
Estimations of the influence factors for a forecast horizon • X1: Death rate • X2: Birth rate • X3: Life expectancy • X4:Unemployment rate • X5: GDP/inhabitant • X6: Number of emigrants • X7: Net migration
The classification functions for the 2008 forecast horizon are: • for the 1st cluster (tend_pos): • Classification of the horizon 2008 in a years-cluster defined by the trend of the influence factors • for the 2nd cluster (tend_ct): • for the 3rd cluster (tend_neg):
The values for the classification functions for the years 2007, 2008 and 2009 are: • For 2009, we notice that the largest score is obtained for the years-cluster tend_ct. Consequently, the forecast horizon, the year 2009, may be classified in the years-cluster with constant trend. • As a result, the employment rate in 2009 will develop under the influence of the constant dynamics of the influence factors.
3.4. The employment rate estimated for the year 2009 • We estimate the employment rate for 2009 based on the trend equation of the employment rate values in the cluster 1995-2001, (tend_ct), characterized by a stationary, constant dynamics of the analyzed phenomena. • The estimated equation for the employment rate is: (Sig.=0,002) (Sig.=0,000) • If we consider the dynamics conditions registered by the years-cluster tend_ct, which has a linear trend, we look forward to an employment rate equal to 55.24% for the year 2009. • The 95% confidence interval for the employment rate are 52,85% and 57,33%.
4. Conclusions • Traditionally, the statistical forecast is done by trend extrapolation. Such a forecast takes into account the trend for the overall time period. This implies the hypothesis of a similar evolution during the entire period, ignoring the specific trend of each factor that defines the development environment of the studied phenomenon. • The analysis we made for the period 1990-2004 underlines a different dynamics of the phenomena, changing both its sign and its value during the analysed period. This is a dynamics specific to the transition periods. • Using the PCA we identified years-clusters defined by different dynamics of the influence factors that have impact on the employment rate.