Impact of High-Fat Diet on Plasma Biomarkers and Adipose Tissue Gene Expression in db/db Mice
90 likes | 219 Vues
This study investigates the effects of a high-fat diet (HFD) on plasma glucose, insulin levels, and adipose tissue gene expression in db/db mice compared to control models. Analysis of fat pad weights and mRNA expression of ATX (autotaxin) suggests significant alterations linked to obesity and metabolic dysregulation. The findings contribute to understanding the molecular underpinnings of obesity-related complications and the roles of adipose tissue in regulating systemic metabolism.

Impact of High-Fat Diet on Plasma Biomarkers and Adipose Tissue Gene Expression in db/db Mice
E N D
Presentation Transcript
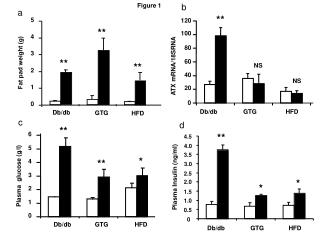
Figure 1 b a ** 5 120 ** 100 4 80 3 ATX mRNA/18SRNA ** Fat pad weight (g) 60 ** NS 2 40 NS 1 20 0 0 Db/db GTG HFD Db/db GTG HFD c d ** ** 6 4.5 4.0 5 3.5 * ** 4 3.0 2.5 Plasma glucose (g/l) Plasma Insulin (ng/ml) 3 * 2.0 * 2 1.5 1.0 1 0.5 0 0 Db/db GTG HFD Db/db GTG HFD
a Figure 2 ** 8 6 Plasma glucose (g/l) 4 2 0 Cont strepto b 600 500 400 Fat pad weight (mg) ** 300 200 100 0 Cont strepto c 70 NS 60 50 ATX mRNA /18S RNA 40 30 20 10 0 Cont strepto
a d ** ** ** 3.0 ** ** 120 2.5 100 ** 2.0 80 ** ATX mRNA / 18S RNA Fat Pad Weight (g) 1.5 60 1.0 40 0.5 20 0.0 0 4 5 6 7 8 9 10 11 12 4 5 6 7 8 9 10 11 12 Age (weeks) Age (weeks) b ** ** 7.0 ** ** ** 6.0 ** 5.0 4.0 Plasma Insulin (ng/ml) 3.0 2.0 1.0 0.0 4 5 6 7 8 9 10 11 12 Age (weeks) c Figure 3
ING PG Figure 4 b a ** 200 200 ** 160 160 120 120 ATX mRNA / 18S RNA ATX mRNA / 18S RNA 80 80 40 40 0 0 PG ING Adipocytes Stroma-vascular cells
Figure 5 *** 18 16 14 *** 12 10 Glucose uptake (nmol 2DG/100 mg lipid/10 min) 8 6 4 * 2 0 basal insulin Basal insulin basal insulin HFD Cont db/db
Figure 6 * 1000 900 800 700 600 500 ATX mRNA / 18S RNA 400 ** 300 ** 200 100 0 Cont TNF rozi TNF + rozi
0 1 2 3 4 [14C]LPC [14C]LPA depot Figure 7 b a MW (kDa) 1 2 3 4 183 114 81 64
Figure 8 50 45 P<0.034 40 35 30 ATX mRNA / 18S RNA 25 20 15 10 5 0 NGT IGT-D