Download
1 / 26
280 likes | 1.3k Vues
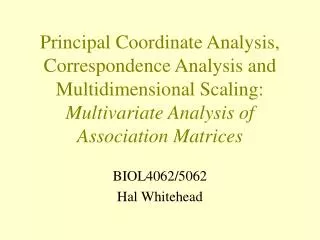
Principal Coordinate Analysis, Correspondence Analysis and Multidimensional Scaling: Multivariate Analysis of Association Matrices. BIOL4062/5062 Hal Whitehead. Association matrices Principal Coordinates Analysis (PCO) Correspondence Analysis (COA) Multidimensional Scaling (MDS).

E N D
Principal Coordinate Analysis, Correspondence Analysis and Multidimensional Scaling:Multivariate Analysis of Association Matrices BIOL4062/5062 Hal Whitehead
Association matrices • Principal Coordinates Analysis (PCO) • Correspondence Analysis (COA) • Multidimensional Scaling (MDS)
The Association Matrix Units: Units:
Similarity Dissimilarity Association matrices • Social structure • association between individuals • Community ecology • similarity between species, sites • dissimilarities between species sites • Genetic distances • Correlation matrices • Covariance matrices • Distance matrices • Euclidean, Penrose, Mahalanobis
Association matricesSymmetric/Asymmetric Grooming rates of capuchin monkeys (Perry 1996) Genetic relatedness among bottlenose dolphins (Krutzen et al. 2003)
Principal Coordinates Analysis • Consider a symmetric dissimilarity matrix B 5 C 3 7 D 5 4 4 A B C • As a distance matrix • And then plot it
D 4 C 4 • 7 5 3 5 B A Principal Coordinates Analysis B 5 C 3 7 D 5 4 4 A B C • Can represent: • distances between 2 points in 1 dimension • distances between 3 points in 2 dimensions • distances between 4 points in 3 dimensions • … • distances between k points in k-1dimensions
10 5 B A Principal Coordinates AnalysisHOWEVER! B 5 C 3 7 D 5 4 4 A B C C ?? • Triangle inequality violated if: • AB + AC < BC • No representation possible
Reduces dimensionality of representation Principal Coordinates Analysis • Take distance (dissimilarity) matrix with k units • Represent as k points in k-1 dimensional space • if triangle inequality holds throughout • Find direction of greatest variability • 1st Principal Coordinate • Find direction of next greatest variability (orthogonal) • 2nd Principal Coordinate • … • k-1 Principal Coordinates
Principal Coordinates Analysis • Eigenvectors of distance matrix give principal coordinates • Eigenvalues give proportion of variance accounted for • Triangle inequality equivalent to: • matrix is positive semi-definite • no unreal eigenvectors • no negative eigenvalues • analysis probably OK if few small, negative eigenvalues
Principal Coordinates Analysis (PCO)& Principal Coomponents Analysis (PCA) • PCO is equivalent to PCA on covariance matrix of transposed data matrix if distance matrix is Euclidean • PCO is equivalent to PCA on correlation matrix of transposed data matrix if distance matrix is Penrose • PCO only gives information on units or variables not both • Axes (principal coordinates) rarely interpretable in PCO
Principal Coordinates Analysis Proportion of time chickadees seen together at feeder SCAO 1.00 AOPR 0.18 1.00 ARPO 0.07 0.27 1.00 YOSA 0.26 0.12 0.12 1.00 ROAY 0.21 0.19 0.18 0.31 1.00 SORA 0.06 0.02 0.03 0.15 0.04 1.00 BJAO 0.19 0.17 0.09 0.16 0.21 0.28 1.00 SCAO AOPR ARPO YOSA ROAY SORA BJAO Ficken et al. Behav. Ecol. Sociobiol. 1981
Principal Coordinates Analysis Proportion of time chickadees seen together at feeder Transformed to distance matrix (1-X) SCAO 0.00 AOPR 0.91 0.00 ARPO 0.96 0.85 0.00 YOSA 0.86 0.94 0.94 0.00 ROAY 0.89 0.90 0.91 0.83 0.00 SORA 0.97 0.99 0.98 0.92 0.98 0.00 BJAO 0.90 0.91 0.95 0.92 0.89 0.85 0.00 SCAO AOPR ARPO YOSA ROAY SORA BJAO
Prin Coord % explained Cumulative Eigenvalue 1 22.77 22.77 0.575 2 20.05 42.82 0.507 3 16.63 59.45 0.420 4 15.17 74.62 0.383 5 13.37 87.98 0.338 6 12.02 100.00 0.304 Principal CoordinatesAnalysis:Chickadeesat Feeder SCAO 1.00 AOPR 0.18 1.00 ARPO 0.07 0.27 1.00 YOSA 0.26 0.12 0.12 1.00 ROAY 0.21 0.19 0.18 0.31 1.00 SORA 0.06 0.02 0.03 0.15 0.04 1.00 BJAO 0.19 0.17 0.09 0.16 0.21 0.28 1.00 SCAO AOPR ARPO YOSA ROAY SORA BJAO
Correspondence Analysis • Uses incidence matrix • counts indexed by two factors • e.g., Archaeology: tombs X artifacts • e.g., Community ecology: sites X species • Data matrix with counts and many zeros
Correspondence Analysis • Distance between two species, i and j, over sites k=1,…,p is (“Chi-squared” measure): ri species totals ck site totals • {Difference in proportions of each species at each site} Then do Principal Coordinates Analysis
Correspondence Analysis • Distance between two species, i and j, over sitesk=1,…,p is (“Chi-squared” measure): • Distance between two sites, k and l, over speciesi=1,…,n is:
Eigenvalue 0.205 Eigenvalue 0.394 Correspondence Analysis Example:Sperm Whale Haplotypes by Clan Reg Short 4-plus #1 48 28 2 #2 8 27 11 #3 9 26 0 #4 0 0 3 #5 1 2 1 #6 1 0 5 #7 4 0 0 #8 0 4 1 #9 0 2 0 #11 3 0 0 #12 0 1 0 #13 4 1 0 #14 1 0 0 #15 1 0 0 mtDNA haplotype
Multidimensional Scaling • “Non-parametric version of principal coordinates analysis” • Given an association matrix between units: • tries to find a representation of the units in a given number of dimensions • preserving the pattern/ordering in the association matrix
Multidimensional Scaling How it works: 1 Provide association matrix (similarity/dissimilarity) 2 Provide number of dimensions 3 Produce initial plot, perhaps using Principal Coordinates 4 Orders distances on plot, compares them with ordering of association matrix 5 Computes STRESS 6 Juggles points to reduce STRESS 7 Go to 4, until STRESS is stabilized 8 Output plot, STRESS 9 Perhaps repeat with new starting conditions
Multidimensional Scaling • STRESS: • dijassociations between i and j • xijassociations between i and j predicted using distances on plot (by regression)
Multidimensional Scaling • Iterative • No unique solution • Try with different starting positions • Different possible definitions of STRESS
Stress 23% Stress 16% Association values Association values Easier to fit Multidimensional ScalingShepard Diagrams Metric Scaling Non-metric Scaling Similar plots to Principal Coordinates
Metric MDS Stress 23% Non-Metric 2-D MDS Non-Metric 3-D MDS Stress 8% Stress 16% Genetic distances between sperm whale groups Principal coordinates 13/14 eigenvalues negative -not a good representation
Multidimensional Scaling • How many dimensions? • STRESS <10% is “good representation” • Scree diagram • two (or three) dimensions for visual ease • Metric or non-metric? • Metric has few advantages over Principal Coordinates Analysis (unless many negative eigenvalues) • Non-metric does better with fewer dimensions
Non-metric Multidimensional Scaling vs. Principal Coordinates Analysis Principal Coordinates MDSCAL Scaling: Metric Non-metric Input: Distance matrix Association matrix Matrix: Pos. Semi-Def. - Solution: Unique Iterative Max. Units: 100's 25-100 Dimensions: More Less Choose no. of dimensions: Afterwards Before