Human Reliability Assessment
Human Reliability Assessment. Grace Kennedy G.A.L.Kennedy@lboro.ac.uk 16 th /19 th October 2006 06ELD061/06ELP461. Objectives for the Sessions. Understand the Human Reliability Assessment process Gain practical experience of a simple task analysis

Human Reliability Assessment
E N D
Presentation Transcript
Human Reliability Assessment Grace Kennedy G.A.L.Kennedy@lboro.ac.uk 16th/19th October 2006 06ELD061/06ELP461
Objectives for the Sessions • Understand the Human Reliability Assessment process • Gain practical experience of a simple task analysis • Gain practical experience of error identification • Gain practical experience of representation • Gain practical experience of quantifying error probabilities in a simple example
Human Error Example 1 • A KC-135 Aircraft was being pressurised at ground level. • The outflow valves were capped off during a 5 year overhaul and never re-opened. • A civilian depot technician was using a home-made gauge, and no procedure. • The technician's gauge didn't have a max "peg" for the needle which had gone round the gauge more than once. • The result….
Pilot misread instruments AND misinterpreted warning signals • Maintenance left pressure control in wrong setting • Manufacturer did not respond adequately to previous similar incidents Human Error Example 2 Helios Crash 2005 Extract taken from BBC News Site http://news.bbc.co.uk/1/hi/world/europe/6036507.stm?ls
“For every $1 spent in the early stage, approximately $10,000 are saved (if the problem were to be fixed later instead).” – Manprint What can be done about it? • Predicting errors • Task analysis and error identification • Preventing errors • Specifying training requirements • Equipment design (e.g. pressure gauge) • Detailed procedures (administrative control) • Ultimately: • Reduce risk • Save money • Justify design decisions
Understanding Human Error Process Risk Assessment Techniques Accident Analyses Psychology Prediction HCI Environment Design What is HRA? • HRA = Human Reliability Assessment
HRA Process Outline • Task analysis is used to describe and understand the human interactions with the system • The results of the task analysis are used with an error taxonomy (classification scheme) to allow error identification • The identified errors are analysed either qualitatively or quantitatively • The process is repeated each time a design iteration occurs
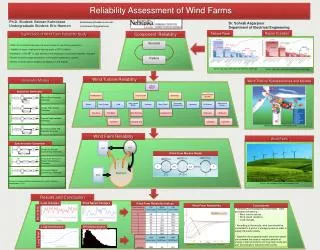
Human Reliability Assessment Process General HRA Process – Kirwan, 1994
Problem Definition Task Analysis Describe what is done Improve analyst’s knowledge Error Identification Taxonomy Failure criteria Representation Fault tree/event tree Risk model Quantification e.g. HEART Impact Assessment Effect of errors Risk contribution Error Reduction Re-design tasks Add engineered features Procedures / training Quality Assurance Appropriate techniques Technical checking Documentation Human Reliability Assessment Process
Process: The overall HRA process Method: The steps in a process e.g. Task Analysis, Quantification, etc Technique: The specific implementation of a method(s) e.g. HEART, THERP, etc Tool: A software tool to record and guide the use of a technique e.g. Fault Tree + Definitions of Terms
HRA Techniques • Many HRA techniques available • Working to different levels of detail on different concepts • From expert judgement techniques (e.g. APJ, PC) • Hazard identification techniques (e.g. HAZOPS, THEA) • To quantitative techniques (e.g. HEART, THERP) • To second generation techniques (e.g. CREAM, ATHEANA)
Human Reliability Assessment Process TASK ANALYSIS General HRA Process – Kirwan, 1994
Task Analysis • Range of techniques to understand what humans are required to do in order to achieve a system goal • Collect and organise information • Improve the analyst’s understanding • Structured approach • Support to design and assessment A Guide to Task Analysis, Barry Kirwan & Les Ainsworth (1992), Taylor and Francis ISBN 07484-0058-3
Hierarchical Task Analysis • Expresses a job or function in terms of goals, operations and plans • Goals Objectives to be achieved • Operations Actions required to achieve the goals • Plans Conditions under which the actions are carried out
Hierarchical Task Analysis Example • Express the task of making a cup of tea using HTA • Goals Objectives to be achieved (e.g. Make Tea) • Operations Actions required to achieve the goals (e.g. Boil water, Add milk / sugar) • Plans Conditions under which the actions are carried out (e.g. boil the water before adding it to the cup) Example provided using TaskArchitect software
Bar beneath the activity shows no further development Stub beneath the activity shows further development has taken place Plan describes the logic Making Tea - one solution (1 of 5)
Hierarchical Task Analysis - Practical • Express the task of fitting an electric plug using HTA • Goals Objectives to be achieved (e.g. Fit plug) • Operations Actions required to achieve the goals (e.g. Strip outer casing, Twist exposed wires) • Plans Conditions under which the actions are carried out (e.g. fit the fuse before closing up the plug to the cup)
Hierarchical Task Analysis - Guidance • State an overall goal (box at the top) • Breakdown each goal or sub-goal one at a time (i.e. finish one box before moving on) • Ensure all the actions under a goal are relevant and would actually achieve the stated goal • Keep the order and logic in the plans (make the plans specific to the goal) Work in Pairs - 10 minutes A solution on pink sheet
Human Reliability Assessment Process ERROR IDENTIFICATION General HRA Process – Kirwan, 1994
Error Identification - General • Task Analysis describes the activities necessary to achieve a goal • An Error Taxonomy (classification scheme) can be used to identify specific errors • Many errors will be possible, so need to understand • Error effects (relating to the task goal) • Failure criteria (goal failure) • Produce a list of identified errors, which lead to goal failure • Organise the information in a Tabular Task Analysis
Error Identification - Tabular Task Analysis • Use the information from the HTA • Create a Tabular Task Analysis (TTA) • Error taxonomy (classification scheme) to identify errors • Understand • Error effects • Failure criteria • List of identified errors
Error Taxonomy • Classification scheme • Generic error types • Similar to HAZOP guidewords • Taxonomy can be made domain specific
Error Taxonomy – SHERPA (see handout) • Example error types for an action task • E3 Action Omitted • E4 Action too much • E5 Action too little • E9 Right action wrong object • E10 Wrong action right object
Tabular Task Analysis - Guidance • See Handout (blank TTA) • Review each activity one at a time • Read through the generic errors in SHERPA • Add error types to the TTA and fill-in the remaining columns (see example for guidance) Work in Groups (max. 5) - 10 minutes
Tabular Task Analysis – Solution to Practical • See handout sheet for example error types against each activity (example is not a comprehensive record) You cannot read this, but . . . see green handout
Error Identification - Question • Assume the fuse must be changed • Review the tasks to achieve the goal at 0.4 • Use the error taxonomy (SHERPA) to identify : • Example of an error leading to no fuse being fitted • Example of an error leading to the incorrect fuse being fitted • Remember • Error Effects • Failure Criteria Work in pairs - 5 minutes
Error Identification Question - One Solution • Errors leading to no fuse being fitted • Step 0.4.4.3, Error E3 Action omitted • Errors leading to the incorrect fuse being fitted • Step 0.4.3, Error E11 Check omitted • Step 0.4.4.1, Error E9 Right action on wrong object
Human Reliability Assessment Process Representation General HRA Process – Kirwan, 1994
Human Reliability Assessment and Risk Models • Risk models will usually include human errors for quantification (human as mitigation) • Human Reliability Assessor will collaborate with the Risk Modeller • Further investigation may be needed in order to carry out Human Reliability Assessment • Additional errors may be identified for inclusion in the risk model • Changes to models may be necessary to represent human error
Risk Assessment - General • Risk = Frequency x Consequence/Severity • Assessment of a complex system requires a structured process (Probabilistic Safety Assessment) • Operation of the system is represented by a model (risk model) • Risk model represents features in the system that prevent or mitigate against serious consequences (e.g. safety systems, intervention from human operators)
Risk Models – A Whirlwind Tour • Hazard identification process used to establish a set of initiating events (what can happen to the system) • Frequency of each initiator is assessed • Consider the effects of each initiator on the system • Typically use event trees to model accident sequences • System features are ‘modelled’ as events in an Event Tree (ask success/failure questions as top events) • Fault trees used to investigate detailed causes of equipment/system/human failure
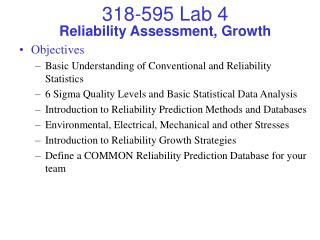
Respond to Alarm Shut Valve Start Pump Success S Success (recovered) 1 - x Initiating event – system leak Failure 1 F x Failure 2 Failure probability = x Success probability = 1 -x An Event Tree
An Event Tree - Quantified Respond to Alarm Shut Valve Start Pump S1 S 0.99 S2 0.999 0.99 0.01 Initiating event – system leak 0.01 F1 F 0.001 F2 P(F) = F1 + F2 = (0.999 x 0.01 x 0.01) + 0.001 = 0.0011 P(S) = 1 – Failure = 1 – 0.0011 = 0.9989
Fault Tree+ from Isograph(http://isograph-software.com/ftpovereta.htm)
For OR use A U B U C For AND use A n B n C A C B A Fault Tree Failure probability = A + B + C – AB – AC – BC + ABC Valve Fails to Shut OR Electrical signal to valve fails Mechanical valve failure Operator fails to demand valve to shut A B C
OR Fault Tree - Practical Example Create a Fault Tree for incorrect fuse in place (i.e. 0.4) • Two types of boolean operators • OR Occurrence of ANY event below causes failure above • AND Only the occurrence of ALL events below causes failure above AND
Fault Tree - Practical Example Guidance • Use the errors identified as the branches to the trees • Think about the HTA to give an indication of the layers required • Think about which operator to use Work in Groups (max. 5) - 10 minutes A solution on blue sheet
Incorrect fuse is in place Appropriate instructions not found Fuse requirements not read Fuse requirement not compared with given fuse Fuse not changed OR OR Correct fuse not selected Fuse not extracted from plug Correct fuse not inserted Fault Tree - A Solution