Download
1 / 11
130 likes | 158 Vues
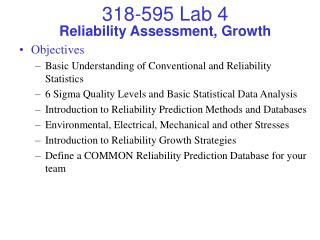
Reliability Assessment, Growth. Objectives Basic Understanding of Conventional and Reliability Statistics 6 Sigma Quality Levels and Basic Statistical Data Analysis Introduction to Reliability Prediction Methods and Databases Environmental, Electrical, Mechanical and other Stresses

E N D
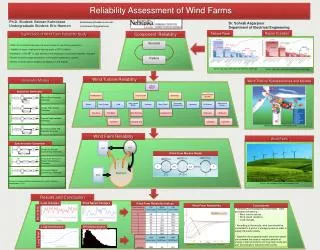
Reliability Assessment, Growth • Objectives • Basic Understanding of Conventional and Reliability Statistics • 6 Sigma Quality Levels and Basic Statistical Data Analysis • Introduction to Reliability Prediction Methods and Databases • Environmental, Electrical, Mechanical and other Stresses • Introduction to Reliability Growth Strategies • Define a COMMON Reliability Prediction Database for your team • Calculate a Reliability Prediction using basic parts count methods • Define economically viable warranty using the Reliability Prediction
Reliability Assessment, Growth • Deliverable – Individual for each Block (Excel and 1 PPT Slide) • Decide which Reliability Database your team will use • Determine your environment • Compile as much of your BLOCK BOM (Bill of Materials) as possible. Goal is min of 5 components including passives • Find the appropriate p stress factors and l values • Compile your overall BLOCK l and MTBF using the Excel Tool • Summarize in 1 PPT slide to include in your block slide package • Conclusions or takeaways about … • What is the total FITs, MTBF? • What are the dominant parts for unreliability? • What if anything could be done to improve the reliability?
Reliability Assessment, Growth • Deliverable – Product Level/Team (Excel File and PPT Slides) • Compile the overall Product l and MTBF by Totaling Block l • Calculate R(warranty), % failures within the original Warranty Period • Then, find a modified warranty period by finding “t” for R(t) = 0.99 (99%) • Decide as a Team which direction to proceed below; • A: Eliminate/change “low hanging fruit” reliability problem components to improve your design to meet the original warranty target • B: Change your product warrant to Time = R(99%) However your warranty must be reasonable for your product type • Update your requirements table, slides, etc if needed to reflect new warranty - Summarize the above calculations to show the following in PPT slides • Conclusions or takeaways about … • Use the Template Slide or Show a Table of Block Numbers, Names, Block l, Total l and MTBF • Identify the dominant parts for unreliability? ( highest individual l) • What design improvements can you or or will you make to increase reliability? • Tell the story of what happened in this exercise
Reliability Assessment, Growth • Optional Deliverable – Product Level/Team (PPT Slide) • Compile a 10 year life stress model using Voltage, Thermal and Vibration stresses for your product that quantifies the following (see template) • Total # of power cycles • Max Voltage Input • Max Range of thermal cycles • Max Number of thermal cycles • Max Vibration in Grms and Total Duration • Max Shock Grms and Total Repetitions • Document the Stress Model in ppt slide • For each of the above stresses, determine the acceleration strategy. • For Coffin-Manson thermal cycle, use exponent of 2 to be conservative • Compile and Document the Reliability Growth Plan by using the Template as shown • Add any additional details regarding the plan such as number of samples tested
595 Standard Stress Factors • Factor Definitions (may not represent standard models) • pT = Temperature Stress Factor = e[Ta/(Tr-Ta)] – 0.4 • Where Ta = Actual Max Operating Temp, Tr = Rated Max Op Temp, Tr>Ta • pV = Cap/Res/Transistor Electrical Stress Factor = e[(Va)/Vr-Va]-2.0 • Where Va = Actual Max Operating Voltage, Vr = Abs Max Rated Voltage, Vr>Va • pE = Environmental (Overall) Factor >>> • Indoor Stationary = 1.0 • Indoor Mobile = 2.5 • Outdoor Stationary = 3.0 • Outdoor Mobile = 5.0 • Automotive = 7.0 • pQ = Quality Factor (Parts and Assembly) • Mil Spec/Range Parts = 0.75 • 100 Hr Powered Burn In = 0.75 • Commercial Parts Mfg Direct = 1.0 • Commerical Parts Distributor = 1.25 • Hand Assembly Part = 3.0
Part Max Tr Max Vr pT pV pE pQ C1 105C 50V 2.082 0.186 2.5 1.25 C2 105C 50V 2.082 0.186 2.5 1.25 C3 85C 15V 3.773 0.223 2.5 1.25 C4 125C 50V 1.548 0.151 2.5 1.25 R1 120C 20V 1.643 0.232 2.5 1.25 R2 150C 6V 1.249 0.549 2.5 1.25 Zener Diode 100C N/A 2.318 1.0 2.5 1.25 Op Amp 125C 36V 1.548 1.0 2.5 1.25 74HCT14 125C 7V 1.548 1.649 2.5 1.25 LED 85C N/A 3.773 1.0 2.5 1.25 Example: Method A, 0-50C Ambient, Indoor Mobile, Distributor Components +5VDC C1 0.1uf 50V Polyester +12VDC C4 0.1uf 50V Ceramic +5VDC LED Vf=1.5V R1 2KW 1/4W Brand A Metal Film Vin BPLR OP AMP R2 150W 1/4W Brand B Metal Film C2 0.1uf 50V Polyester 74HCT14 5V 1W Zener C3 10uf 15V Electrolytic -12VDC lFITS 10.29 10.29 552.2 1.46 0.83 1.50 23.18 67.73 217.77 106.16 991.37 Fits 115.1 Yrs MTBF
Project Reliability Rollup Initial 90 Day Warranty Period Selected would result in 3% total failures Consider setting warranty to 1 month or 30 days based on the 1% Total Failure Guideline or …. Decrease l Total