Download
1 / 24
240 likes | 273 Vues
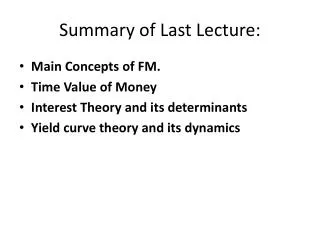
Summary of last weeks work on Variables. Examples:. Predict that there is a relationship between two variables. Type of insulating material affects temperature drop over 10 mins. An independent variable is one that is changed or selected by you the investigator.

E N D
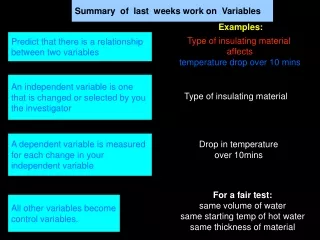
Summary of last weeks work on Variables Examples: Predict that there is a relationship between two variables Type of insulating material affects temperature drop over 10 mins An independent variable is one that is changed or selected by you the investigator Type of insulating material A dependent variable is measured for each change in your independent variable Drop in temperature over 10mins For a fair test: same volume of water same starting temp of hot water same thickness of material All other variables become control variables.
Temperature Change / 0C 25 23 30 23 Type of insulation Paper towel Bubble wrap Felt Foil Your GCSE course work will be given next week. It is important that you know what to do! YOUR TASK: Plot a bar chart of the following data on the sheet of graph paper provided Bar charts are for: non continuos variables: categoric, discrete (whole number) quantities. Marks are given for * good use of paper and scale * labelled axes with units * bar lengths correct with labels * bars of constant width
Temperature Change / 0C 25 23 30 23 Temperature change 0C Marks are given for * good use of paper and scale * labelled axes with units * bar lengths correct with labels * bars of constant width 50 40 Type of insulation 30 Paper towel Bubble wrap 20 Felt Foil 10 Type of insulation Felt Foil Bubble wrap Paper towel
Temperature change 0C Marks are given for * good use of paper and scale * labelled axes with units * bar lengths correct with labels * bars of constant width 50 Bar charts are for: non continuos variables: categoric, discrete (whole number) quantities. 40 30 20 10 Type of insulation Felt Foil Bubble wrap Paper towel
Investigative Skills Assignment (ISA) Some background information before we start • ISA’s are a new part of your science course. They are designed to take the place of coursework • They are worth 25% of your GCSE in science. • You get marks for drawing a results table and a graph but most of your marks are scored when you sit a short test and answer questions on the experiment you did. • We will tell you what you need to know before the test. If you listen carefully, you will get high marks.
Investigative Skills Assignment (ISA) Are you ready to take notes? Here we go.
Thermal Insulation ISA We are going to investigate how the rate of heat loss from a beaker of hot water, depends upon the type of insulation it has. Record the initial temperature of the water and the final temperature after 10 minutes, and then repeat for different types of insulation. Thermometer Card lid with hole 200ml of very hot kettle water. CARE!
About the experiment In this experiment, which would be the independent variable? (this is the variable that you deliberately change) The type of insulation. How many values should this variable have? (this means how many different types of insulation should we use – give a reason?) Enough so that I could see an effect. This could be 4 types.
About the experiment What is the main measuring instrument in this experiment? Thermometer What is the precision of a thermometer? – (this is the smallest division on the thermometers scale) 1˚C If we used a digital thermometer that could read to 0.1˚C what effect would this have on the precision of our results The results would be more precise. The precision of the results would have increased.
About the experiment What are the other variables in this experiment? • size of beaker • starting temperature of the water • the amount of cooling time they get • what the beaker is made of • the amount of water The results would not be valid. If you saw a difference in your results you could not be sure of what was causing the difference Why is it important to keep these variables the same throughout the whole experiment?
About the experiment How could the reliability of the data (results) be improved? By repeating each experiment several times more, and averaging the results Why would this improve the reliability of the results? This would reduce the effect of random errors like reading the thermometer incorrectly
ISA SECTION 2 QUESTIONS Find the anomalous piece of data from this results table. Temperature changes after 10 minutes (ºC) Insulation Temperature change ( ºC ) Start ( ºC ) final ( ºC ) Paper towel 88 63 25 Bubble wrap 90 67 23 felt 37 4.6 37 50 87 Aluminium foil 88 55 33
Results chart: Temperature changes after 10 minutes (ºC) Insulation Temperature change ( ºC ) Start ( ºC ) final ( ºC ) Paper towel 88 63 25 Bubble wrap 90 67 23 felt 4.6 57 30 87 Aluminium foil 88 55 33
Results chart: Temperature change after 10 minutes (ºC) Insulation Paper towel Bubble wrap Felt Aluminium foil Temperature change ( ºC ) Start ( ºC ) final ( ºC )
Temperature Change / 0C 25 23 30 23 Temperature change 0C Bar charts are for: non continuos variables: categoric, discrete (whole number) quantities. Marks are given for * good use of paper and scale * labelled axes with units * bar lengths correct with labels * bars of constant width 50 40 Type of insulation 30 Paper towel Bubble wrap 20 Felt Foil 10 Type of insulation Felt Foil Bubble wrap Paper towel
Temperature change 0C Marks are given for * good use of paper and scale * labelled axes with units * bar lengths correct with labels * bars of constant width 50 Bar charts are for: non continuos variables: categoric, discrete (whole number) quantities. 40 30 20 10 Type of insulation Felt Foil Bubble wrap Paper towel
CONCLUSION: The smallest drop in temperature occurred using ………..……………..….. So ……………………..………….…… is the best insulating material. Temperature change 0C 50 Bubble wrap Bubble wrap 40 30 Marks are given for * good use of paper and scale * labelled axes with units * bar lengths correct with labels * bars of constant width 20 Bar charts are for: non continuos variables: categoric, discrete (whole number) quantities. 10 Type of insulation Felt Foil Bubble wrap Paper towel
Spotting anomalous results Solubility in 10ml of water (g) substance 20ºC 40ºC 60ºC salt 1.2 1.4 1.6 sugar 3.9 4.1 4.0 coffee 4.6 1.8 1.9 flour 0.3 0.2 0.4 Try to spot the anomalous piece of data from this results table. Hands up! 4.6
Solubility in 10ml of water (g) substance 20ºC 40ºC 60ºC substance salt 1.2 1.4 1.6 salt sugar 3.9 4.1 4.0 sugar 1.8 1.9 coffee 4.6 coffee flour 0.3 0.2 0.4 flour Using these results, what has more effect on solubility? Is it the temperature or the type of substance?
Solubility in 10ml of water (g) substance 20ºC 40ºC 60ºC salt 1.2 1.4 1.6 sugar 3.9 4.1 4.0 1.8 1.9 coffee 4.6 flour 0.3 0.2 0.4 What would be the best way of displaying the results for the 20ºC experiments? a) Bar graph a) Bar graph b) Line graph c) Pie chart d) Scatter graph
Solubility in 10ml of water (g) substance 20ºC 40ºC 60ºC salt 1.2 1.4 1.6 sugar 3.9 4.1 4.0 1.8 1.9 coffee 4.6 flour 0.3 0.2 0.4 Why would this be the best way? Plotting data from different substances is not a continuous variable. Different substances are a categoric variable.
Investigative Skills Assignment (ISA) I hope this helps you get high marks! The end!
Temperature change 0C 50 40 30 20 10 Type of insulation Felt Foil Bubble wrap Paper towel