Remote Sensing Applications in Wine Grape Production: NDVI Analysis and Crop Assessment
In collaboration with Ste. Michelle Wine Estates and CropMaps, WSU utilized digital multispectral imagery during the 2003-2004 growing seasons to assess wine grape production. By integrating a digital multispectral camera, WSU developed an airborne image capture system to process NDVI and canopy density maps, enabling the assessment of crop quality. This technology capitalizes on the reflective properties of healthy plants, aiding in the identification of crop vigor and moisture levels, optimizing harvest uniformity, and improving vineyard management strategies.

Remote Sensing Applications in Wine Grape Production: NDVI Analysis and Crop Assessment
E N D
Presentation Transcript
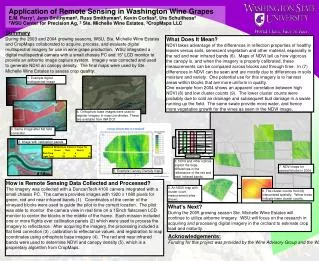
Summary During the 2003 and 2004 growing seasons, WSU, Ste. Michelle Wine Estates and CropMaps collaborated to acquire, process, and evaluate digital multispectral imagery for use in wine grape production. WSU integrated a digital multispectral camera with a small chassis PC and 15” LCD monitor to provide an airborne image capture system. Imagery was corrected and used to generate NDVI an canopy density. The final maps were used by Ste. Michelle Wine Estates to assess crop quality. What Does It Mean? NDVI takes advantage of the differences in reflection properties of healthy leaves versus soils, senescent vegetation and other material, especially in the red and near infrared bands (6). Maps of NDVI tell us how vigorous the canopy is, and when the imagery is properly calibrated, these measurements can be compared across blocks and through time. In (7) differences in NDVI can be seen and are mostly due to differences in soils moisture and variety. One potential use for this imagery is to harvest areas within blocks that are more uniform in quality. One example from 2004 shows an apparent correlation between high NDVI (8) and low cluster counts (9). The lower cluster counts were probably due to cold air drainage and subsequent bud damage in a swale running up the field. The same swale provide more water, and hence more vegetative growth for the vines as seen in the NDVI image. Application of Remote Sensing in Washington Wine GrapesE.M. Perry1, Jenn Smithyman2, Russ Smithyman2, Kevin Corliss2, Urs Schulthess31WSU Center for Precision Ag, 2Ste. Michelle Wine Estates, 3CropMaps LLC 1. Example digital multispectral image 4. Orthophoto base images were used to register imagery to map coordinates. These are available from WA DOT 3. Same image after flat field correction 2. Image with calibration panels 6. NDVI and other indices exploit the large differences in the reflectance of the red and near infrared bands. 7. NDVI maps for several blocks in 2004 5. Example Canopy Density map. How is Remote Sensing Data Collected and Processed? The imagery was collected with a DuncanTech 4100 camera integrated with a small chassis PC. The camera provides images with 1920 x 1080 pixels for green, red and near infrared bands (1). Coordinates of the center of the vineyard blocks were used to guide the pilot to the correct location. The pilot was able to monitor the camera view in real time on a 15inch flatscreen LCD monitor to center the blocks in the middle of the frame. Each mission included one or more flights over calibration panels (2) which were used to process the imagery to reflectance. After acquiring the imagery, the processing included a flat field correction (3) , calibration to reflectance values, and registration to map coordinates using orthophoto base imagery (4). The red and near infrared bands were used to determine NDVI and canopy density (5), which is a proprietary algorithm from CropMaps. 8. An NDVI map with cluster count measurement sites shown. 9. The cluster counts from (6) interpolated spatially. Yellow tones indicate lower cluster counts. What’s Next? During the 2005 growing season Ste. Michelle Wine Estates will continue to utilize airborne imagery. WSU will focus on the research in acquiring and processing digital imagery in the orchard to estimate crop load and maturity. Acknowledgements: Funding for this project was provided by the Wine Advisory Group and the Washington State University Center for Precision Agricultural Systems. Imagery flown by Infrared Image Solutions Inc in Hermiston OR.