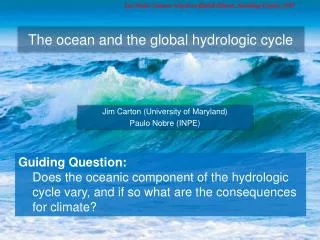
Understanding Reservoirs and Measurement Methods of the Hydrologic Cycle
This article explores the components and measurement techniques of the hydrologic cycle. Key terms include "reservoirs," which are water storage locations within the Earth system, and "transport pathways," detailing how water circulates between these reservoirs. It discusses traditional and geodetic measurements used by scientists, including stream gaging stations, groundwater depth monitoring, SNOTEL stations for snow mass, and GRACE technology for gravity measurement. By understanding these measurement methods, we can better grasp the dynamics of water movement in our environment.

Understanding Reservoirs and Measurement Methods of the Hydrologic Cycle
E N D
Presentation Transcript
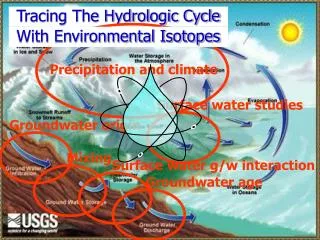
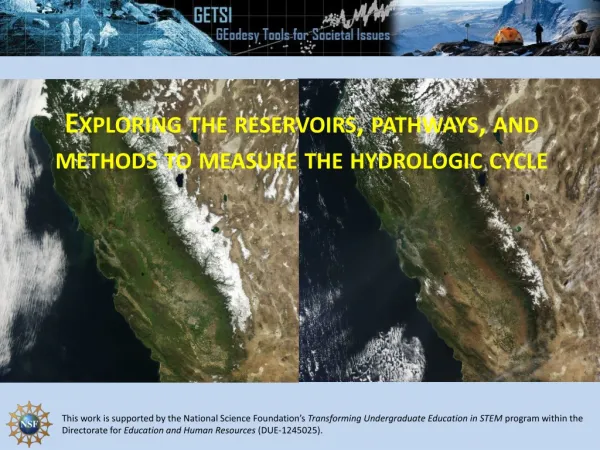
Exploring the reservoirs, pathways, and methods to measure the hydrologic cycle
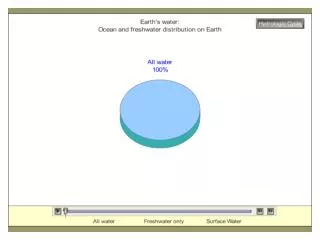
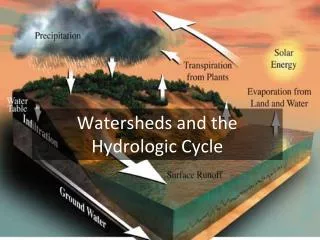
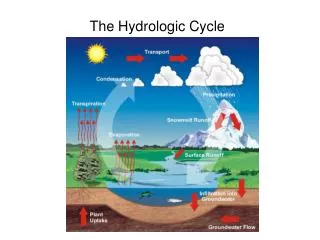
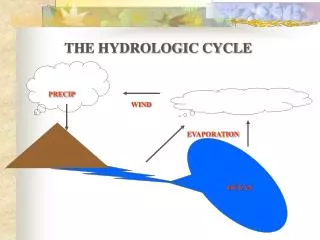
Hydrologic Cycle Terminology “Reservoirs” are places where water is stored in the Earth system. “Transport pathways” describe the mechanisms and pathways that water moves among reservoirs in the Earth system. Cockell, 2008 Fig. 1-38
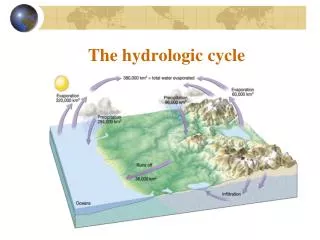
Annual Hydrological Cycle Cockell, 2008 Fig. 1-38
Reservoirs Annual Hydrological Cycle Cockell, 2008 Fig. 1-38
Annual Fluxes for Ocean Reservoir IN = OUT 391 + 46 = 437 Cockell, 2008 Fig. 1-38
Annual Fluxes for Atmospheric Reservoirs IN = OUT 436.5 + 65.5 = 391 + 111 502 = 502 Cockell, 2008 Fig. 1-38
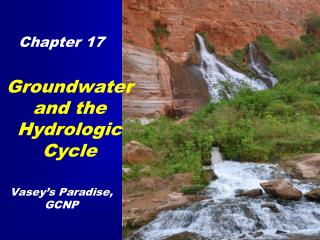
How do scientists measure the hydrologic cycle? • Examples of “traditional” hydrologic measurements: • stream/river gaging stations • depth to groundwater • SNOTEL stations (snow mass) • Examples of geodetic hydrologic measurements: • Reflection GPS • Vertical GPS • GRACE
How do scientists measure the hydrologic cycle?stream/river gaging stations
Example: USGS Willow Creek gaging station 06035000 near Harrison, MT Used to calculate discharge (the volume of water moving through the channel in a given amount of time, i.e., flow rate)
How do scientists measure the hydrologic cycle?Depth-to-groundwater using wells
Depth-to-groundwater using wells Surface elevation Depth to water Total depth of well Water level = (surface elevation) – (depth to water)
USGS Groundwater Wells https://water.usgs.gov/ogw/
Example of Groundwater record for the South Willow Alluvial Wells
SNOTEL stations Weight of snow on the pillow allows measurement of contained water mass
Albro Lake SNOTEL Site State: Montana Site Number: 916 County: Madison Latitude: 45 deg; 36 min N Longitude: 111 deg; 58 min W Elevation: 8300 feet Reporting since: 1996-09-11
Geodesy is… …the science ofaccurately measuring the Earth’s size, shape, orientation, mass distribution and the variations of these with time. Traditional geodesy: Precise positioning of points on the surface of the Earth Modern geodesy: A toolbox of techniques to better measure the Earth wikipedia.org JPL/NASA 24
GPS Networks Thousands of stations across continental United States Data latency of ~1 day http://geodesy.unr.edu/NGLStationPages/gpsnetmap/GPSNetMap.html
GPS Data Cycles in vertical position are related to the seasonal water changes.
GPS Vertical Position The solid Earth responds elasticallyto changes in load, such as water loss from regional groundwater pumping or drought instantaneous, reversible, linear Plate Boundary Observatory station P037