Download
1 / 13
130 likes | 305 Vues
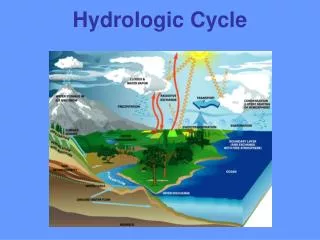
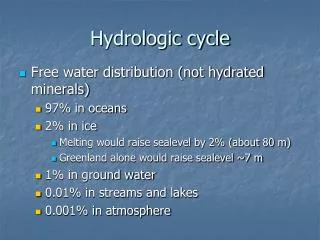
Precipitation trends and the hydrologic cycle. AOS 101 Weather and Climate Lisha M. Roubert University of Wisconsin-Madison Department of Atmospheric & Oceanic Sciences. Precipitation.

E N D
Precipitation trends and the hydrologic cycle AOS 101 Weather and Climate Lisha M. Roubert University of Wisconsin-Madison Department of Atmospheric & Oceanic Sciences
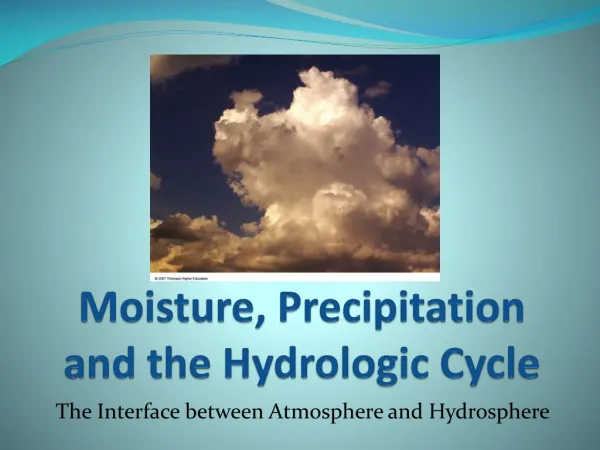
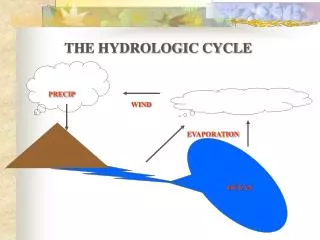
Precipitation • Precipitation: Any or all of the forms of water particles (liquid or solid) that fall from clouds and reach the ground. It includes: • liquid precipitation (drizzle, rain) • freezing precipitation (freezing drizzle, freezing rain) • frozen precipitation (snow pellets, snow grains, ice crystals, ice pellets, hail)
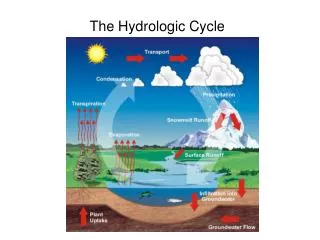
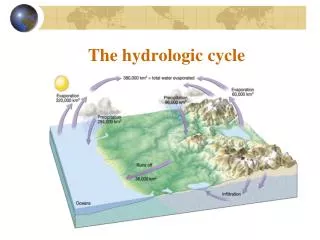
Precipitation Formation-Summary • Precipitation is product of the condensation (gas to liquid) of atmospheric water vapor. • For condensation to take place, the air must be saturated and there must be a surface on which the vapor can condense. In the air above the ground, tiny particles known as cloud condensation nuclei serve as the surfaces on which water vapor condenses. • For precipitation to form, millions of cloud droplets must coalesce into drops large enough to avoid breaking apart or evaporating during their descent.
Cloud Seeding • Supposed to boost precipitation by introducing artificial condensation nuclei, such as salt and dry ice into clouds that have the right conditions. • The artificial nuclei then attract water vapor within the clouds system to become larger droplets. • Once the raindrops get big and heavy enough, the droplets fall as rain • Research about the effectiveness is inconclusive to date.
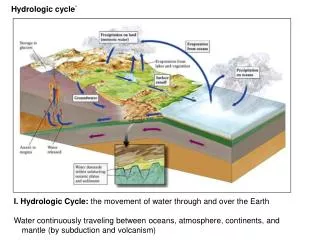
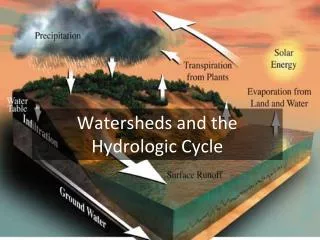
Precipitation and Evaporation Trends • For precipitation to occur we need water vapor. To have water vapor in the atmosphere we need evaporation. • Precipitation exceeds evaporation in the Tropics and in the very high latitudes. • But why is evaporation greater in the subtropics than in the Equator?
A few reasons: • The eastern equatorial Pacific is a region of cold currents and upwelling. • Deep convective clouds reduce the amount of solar radiation. • Low wind speeds in the equator reduce evaporation. • Ocean transport.
Comparing Vertical Velocity with E-P Vertical Velocity Evaporation-Precip • Regions of ascent (negative values=blue) agree with regions where P>E (brown). • Regions of descent (positive values=red) agree with regions where E>P (green). Vertical velocity at 500 hPa, July average in units of pascals per second. Ascent (negative values) is concentrated close to the solar equator; descent (positive values) is more diffuse.
Precipitation for Wisconsin • From 1950 to 2006, Wisconsin as a whole has become wetter, with an increase in annual precipitation of 3.1 inches. • This observed increase in annual precipitation has primarily occurred in southern and western Wisconsin, while northern Wisconsin has experienced some drying. Change in Annual Average Precipitation (inches) from 1950 to 2006
Extreme Precipitation Events Projections for Wisconsin • Typically, heavy precipitation events of at least two inches occur roughly 12 times per decade (once every 10 months) in southern Wisconsin and 7 times per decade (once every 17 months) in northern Wisconsin. • By the mid-21st century, Wisconsin may receive 2-3 more of these extreme events per decade, or roughly a 25% increase in their frequency. Projected Change in the Frequency of 2" Precipitation Events (days/decade) from 1980 to 2055
Today: • You will be making maps of precipitation for Wisconsin and for other regions to study precipitation trends. • You will be using the NOAA Earth Sciences Research Laboratory (ESRL) Online mapping tool. • You will also be studying the Annual Variation of the water balance for different regions.