Elderly
Elderly. Tori-Ann Williams-PowerPoint Expert Randy McElfresh-Group Leader/APA Shalonda Wright-Group Editor. Social Demographics Major Trends Beliefs and Stereotypes Changing Stereotypes Treatment in the USA Elderly Values Elderly Beliefs Norms 9. Changes in Norms


Elderly
E N D
Presentation Transcript
Elderly Tori-Ann Williams-PowerPoint Expert Randy McElfresh-Group Leader/APA Shalonda Wright-Group Editor
Social Demographics Major Trends Beliefs and Stereotypes Changing Stereotypes Treatment in the USA Elderly Values Elderly Beliefs Norms 9. Changes in Norms 10.Groups Strengths 11. References Outline
According to the World Health Organization the chronological age of 65 years have been accepted as the definition of 'elderly' or older person in the majority of developed world countries.Some of the factors that play into defining elderly or old age is loss of role in society, the physical decline or function and the countries retirement age. What to consider with the elderly?
The United Census Bureau (2011) states 39 million of American are 65 and older which is 12.8 percent of the US population. • The number of people that are consider elderly is constantly increasing. Between 2000 and 2050, the proportion of the world's population over 60 years will double from about 11% to 22%. Population Number
The Elderly population are living and relocating to warmer, smaller and lower costing cities. • More seniors of 65 and older living in the south region of the country (The United States Census Bureau , 2012). Where do they live?
According to the United States Census Bureau (2012) there are more senior females living 65 years or older than males. The female senior population is 14. 2 percent of the US population versus the 11.3 percent of senior males. Female to Male Ratio
What is the Leading Cause of Death among the elderly? • The leading cause of death among the elderly is falling down. Traumatic brain injuries resulting from these falls make up 46% older adult fatalities. (Die, 2007) • Work for the Elderly?As of December, 1.31 million people ages 75 and older were working, a 25% jump from 1.05 million in 2005, according to the Bureau of Labor Statistics. Now, 7.3% of the oldest Americans have jobs, up from 5.3% a decade ago and the highest level since 1966, according to the Center for Retirement Research at Boston College.(The Wall Street Journal,2012) Specific Trends
Wisdom , Experience and Insight • More Valued in Agrarian society vs. Industrial Societies like the Unites States • Dependent • Some other stereotypes of Elderly that they are senile, often looked at as delusional and disabled. Stereotypes and Beliefs
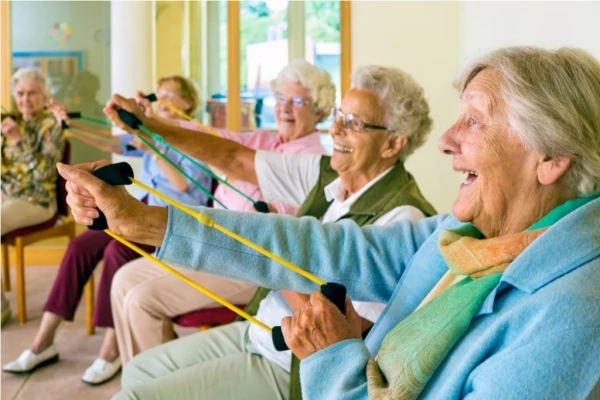
Positive Changes for the Elderly Access to better :Health CarePersonal CareWorking LongerSpiritualitySexual Activity
Treatment in the United States Lived in poverty; suffered from abuse and mistreatment Employment discrimination The Older American Act Passed in 1964 under President Johnson fought against poverty. Social Security Act of 1935 under President Roosevelt.
They value life and make changes to achieving a longer, healthier life. • Relationships • Their beliefs What do the Elderly Value ?
older adult study findings? • Self-esteem Controversy? • Are they Liberal or Conservative? Their values change over time and self esteem follows?
What are the norms for the elderly? Not much is expected from outside the group as they are supposed to just cease into eternity The 2007 life expectancy Women average age of life was 81.3 Men average age of life was 76.7
How have these norms changed over time? They are living longer The life expectancy in 1949-1951 71 for Women 65.5 for Men We are now living over 10 years longer Due to the changes of a longer, healthier life, their norms have changed also They maintain relationships When they speak it is usually of importance Their wisdom usually is honored with open ears as they are to be respected They practice proper etiquette and live to set the standard for others to follow These rules will continue to change as the elderly live longer
AARP • Senior Community Centers • Adult Daycares • Nursing homes • Hospice Care • Social Security Act • The Older American Act • The Gray Panthers • The Social Service America • Medicaid Elderly Resources, Policies, and Services
Wisdom • Resiliency • Spirituality Strengths of the Elderly
Ashford, J. B., & Lecroy, W. C. (2010). Human Behavior in the Social Environment. Belmont: Cengage Learning. • Congressional Research Service. (2007). Where Do Older Americans Live? CRS. • Jacobs, T. (2010, October 7). For Elderly, Conservative Beliefs Buffer Self-Esteem. Retrieved April 10, 2013, from Pacific Standard: http://www.psmag.com/culture-society/for-elderly-conservative-beliefs-buffer-self-esteem-23654/ • Die, B. (2007, October 18). AANS - Taking Simple Precautions Can Help Prevent Falls and Devastating Head Injuries. AANS - AANS Home Page. Retrieved April 15, 2013, from http://www.aans.org/en/Media/General%20Press%20Releases/2007/October/Taking%20Simple%20Precautions%20Can%20Help%20Prevent%20Falls%20and%20Devastating%20Head%20Injuries.aspx?sc_database=web • Park, A. (2011, June 15). U.S Life Expectancy Lags, Slips in Women. Retrieved April 10, 2013, from Time Health & Family: http://healthland.time.com/2011/06/15/u-s-life-expectancy-lags-slips-in-women/Shrestha, L. B. (2005). Life Expectancy in the United States. CRS Report for Congress, CRS-3. • The United States Census Bureau . (2012, November 28). The Older Population in the United States: 2011. Retrieved from United State Census Bureau: www.census.gov/population/age/data/2011.html • The World Health Organization. (2012, March 28). Aging and Life Course: Interesting facts about ageing. Retrieved from The World Health Organization : http://www.who.int/healthinfo/survey/ageingdefnolder/en/ References