2 to 20 years: Boys
120 likes | 301 Vues
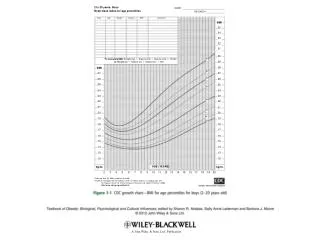
2 to 20 years: Boys. NAME. Body mass index-for-age percentiles. RECORD #. Date. Age. Weight. Stature. BMI*. Comments. BMI. 35. 34 33 32 31. 30. *To Calculate BMI: Weight (kg) ÷ Stature (cm) ÷ Stature (cm) × 10,000. 95. 29. or Weight (lb) ÷ Stature (in) ÷ Stature (in) × 703.

2 to 20 years: Boys
E N D
Presentation Transcript
2 to 20 years: Boys NAME Body mass index-for-age percentiles RECORD # Date Age Weight Stature BMI* Comments BMI 35 34 33 32 31 30 *To Calculate BMI:Weight (kg) ÷ Stature (cm) ÷ Stature (cm) × 10,000 95 29 or Weight (lb) ÷ Stature (in) ÷ Stature (in) × 703 28 BMI 90 27 27 85 26 26 25 25 75 24 24 23 23 50 22 22 21 21 25 20 20 10 19 19 5 18 18 17 17 16 16 15 15 14 14 13 13 12 12 AGE (YEARS) kg/m2 kg/m2 2 3 4 5 6 7 8 9 10 11 12 13 14 15 16 17 18 19 20 Published May 30, 2000 (modified 10/16/00). SOURCE: Developed by the National Center for Health Statistics in collaboration with the National Center for Chronic Disease Prevention and Health Promotion (2000). http://www.cdc.gov/growthcharts A John Wiley & Sons, Ltd., Publication
2 to 20 years: Girls NAME Body mass index-for-age percentiles RECORD # Date Age Weight Stature BMI* Comments BMI 35 34 33 32 31 95 30 *To Calculate BMI: Weight (kg) ÷ Stature (cm) ÷ Stature (cm) × 10,000 29 orWeight (lb) ÷ Stature (in) ÷ Stature (in) × 703 28 BMI 90 27 27 26 26 85 25 25 24 75 24 23 23 22 22 50 21 21 20 20 25 19 19 10 18 18 5 17 17 16 16 15 15 14 14 13 13 12 12 AGE (YEARS) kg/m 2 kg/m2 2 3 4 5 6 7 8 9 10 11 12 13 14 15 16 17 18 19 20 Published May 30, 2000 (modified 10/16/00). SOURCE: Developed by the National Center for Health Statistics in collaboration with the National Center for Chronic Disease Prevention and Health Promotion (2000). http://www.cdc.gov/growthcharts A John Wiley & Sons, Ltd., Publication
80 70 60 50 Men 40 Women All 30 20 10 0 Total 25-29.9 30+ 40+ A John Wiley & Sons, Ltd., Publication
45 40 35 30 25 Non-Hispanic White Non-Hispanic Black 20 Mexican-American 15 10 5 0 MEN WOMEN A John Wiley & Sons, Ltd., Publication
25 20 15 Boys Girls All % 10 5 0 2-5 y 6-11 y 12-19 y 2-19 y A John Wiley & Sons, Ltd., Publication
25 20 15 Boys Girls All % 10 5 0 Hispanic Mexican Non-Hisp Non-Hisp White Black American A John Wiley & Sons, Ltd., Publication
30 25 20 Boys Girls All % 15 10 5 0 Hispanic Mexican Non-Hisp Non-Hisp White Black American A John Wiley & Sons, Ltd., Publication
18 16 14 12 % 10 2001 8 6 4 2 0 <200 employees 200+ employees A John Wiley & Sons, Ltd., Publication
100 90 80 70 60 2000 % 50 2001 40 2002 30 20 10 0 <200 200+ A John Wiley & Sons, Ltd., Publication
$3,500 $3,000 $2,500 $2,000 $1,500 $1,000 $500 $0 20-24 25-29 30-34 35+ A John Wiley & Sons, Ltd., Publication
$3,500 $3,000 $2,500 $2,000 $1,500 $1,000 $500 $0 20-24 25-29 30-34 35+ A John Wiley & Sons, Ltd., Publication
$4,000 $3,500 $3,000 $2,500 $2,000 $1,500 $1,000 $500 $0 19-24 25-29 30-34 35-39 40+ A John Wiley & Sons, Ltd., Publication