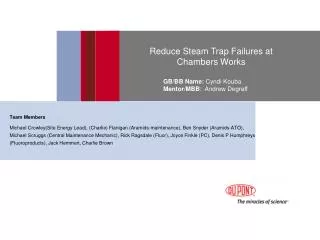
Team Members
Using Quality Improvement Tools to Improve Interprofessional Education Performance Improvement Leadership Development Program University of Missouri – Columbia February 19, 2010. Team Members. Carla Dyer, MD School of Medicine Deepti Vyas, PharmD UMKC School of Pharmacy

Team Members
E N D
Presentation Transcript
Using Quality Improvement Tools to Improve Interprofessional EducationPerformance Improvement Leadership Development ProgramUniversity of Missouri – ColumbiaFebruary 19, 2010
Team Members • Carla Dyer, MD School of Medicine • Deepti Vyas, PharmD UMKC School of Pharmacy • Dena Higbee, MS SheldenSimulation Center • Gretchen Gregory, MSN School of Nursing • Sue Boren, PhD Health Management and Informatics • Rusty McCulloh, MDBrown School of Medicine Team Sponsor: Linda Headrick, MD Coaches: Julie Brandt, PhD and Christina Vollrath, MSN
Interprofessional Education in Quality, Safety and Teamwork • Focus: Patient safety, QI, and teamwork/communication • Four week Curriculum: 7 hours total • Began in 2003 • Five disciplines: Medicine, Nursing, Respiratory Therapy, Health Administration, and Pharmacy
2008 Curriculum • Introductory Lecture • Quality and safety basics • Local and national context • Small Group Sessions—six hours • Interprofessional Roles • Modified root cause analysis • Brainstorming solutions; effort vs. yield • Final Group Presentations
Background: 2008 Curriculum • Post-course evaluations, on average, demonstrated a decrease in the perceived value of the interprofessional experience and its benefit to their future careers % Students who felt experience would benefit future career
Flow of the Curriculum in 2009 Introductory Lecture QI and Safety Basics Local and National Context National Safety Goals (1 hour) Small Group Sessions --Professional Roles --Case Discussion --Modified Root Cause Analysis --Brainstorming Solutions (3 hours) IP Simulation Emphasizing Teamwork and Safety (1 1/2 hours)
Simulation Scenario • Semi-urgent setting • 5-6 patients/group of 10-12 students • Variable acuity and ages • Communication and teamwork issues • National Patient Safety goals incorporated
2009 Simulation Cases—Integrating Teamwork and Safety **Based on 18 small groups
Aim Statement To increase interprofessional students’ recognition of selected patient safety threats by 25% from baseline by February 2010 through improved student preparation and modification of measurement process.
Why choose safety? • MU SOM Key Characteristics of our graduates: “committed to improving care” • MU SON Core Curriculum Concepts: Patient Safety • Similar accreditation requirements for other programs • Institution: Closely related to Quality, Service, People, and Finance
Stakeholders • Students • Faculty school of medicine, nursing, pharmacy and health professions • SheldenSimulation Center Staff • Office of Clinical Effectiveness • Senior education leaders and Administrators at the University Hospital • Patients– “downstream”
Effort vs. Yield Low Impact High Impact Low Effort High Effort
Focus Areas for Change • Increased emphasis on safety in lecture and small group • Measurement tools: • Increasing Faculty Observer Ratio • Simplifying Tool and increasing patient role • Improving Audiovisual capabilities to capture encounters for future analysis • Introduction of Environmental Assessment (based on Safety Seals)
A “Primer” in Safety Environmental Assessment Exercise (1/2) Debrief Session 30 minutes Deliverable Report (5 minutes) Debrief Session 30 minutes Team Formation (10 minutes) Simulation (20 minutes) Team Formation (10 minutes) Simulation (20 minutes) Deliverable Report (5 minutes) Environmental Assessment Exercise (All)
Measuring Change • Measured frequency of potential patient safety hazards recognized by students in the interprofessional simulation • Standardized patients • Faculty observers • Order sheets
Measuring Change • Outcome Indicators • Potential safety hazards identified • Pre/Post Knowledge, Skills, Attitude survey • Course Evaluation • Process Indicators • Qualitative feedback from students/faculty during dry runs • Qualitative feedback from surveys • Students and Faculty
Student Feedback Positives: --Enjoyed working in teams --Learned from the other students perspectives, especially from nurses Negatives: Needed more time Perceived value: (5=high) • As individual: 3.79 / 5 • As team: 4.13 / 5
Return on Investment • Increased awareness of potential patient safety risks in future health care providers • Thousands of dollars potential cost saving to institution • Use of gait belts • Recognition of medication errors • Effective handoffs • Decreasing morbidity and mortality of our patients
Costs of Environmental Assessment • Standardized patients: 8 ----> $312 • Faculty: 13 faculty and 2 grad students • 2 hours / 4 hours • 76.5 hrs Manpower • Equipment (in kind) • Simulation Center space (in kind) • Faculty/staff time spent planning and implementing
Other Costs • Increased Faculty Observers • 24 additional faculty—three hours each • Increased Equipment Cost (microphones) --$16,000
Challenges • Cycle of improvement is long • Yearly Data collection • Large amounts data/very short time frame • Pressure to improve several areas at one time • Logistics of coordination— • 274 students --28 standardized patients • >50 faculty/staff • Applying QI concepts to education
Lessons Learned • Applying QI concepts to improving education is achievable; continuous improvement is critical to curricular success • Using technology that supports QI principles • Access to resources and mentoring increases success—coaches, sponsors, research faculty • Balanced team is key to success—highly invested members; interprofessional representation
Interprofessional Curriculum 2010 Groups of Students: 24 Faculty/Staff: >50 Students in simulation: 274 Environmental safety room encounters: 404 Safety Issues recognized: over 5000 Future impact on their patients: priceless
Summary • Continue work regarding effectiveness of “primer” to increase effectiveness of IP simulation • Fine tune measurement tools • Reinforce patient safety concepts in “real life” setting • Emphasize value of interprofessional care and IP education
Questions??? Carla Dyer, MD Dyerca@health.missouri.edu University of Missouri School of Medicine Deepti Vyas, Pharm D Vyasde@umkc.edu University of Missouri-Kansas City School of Pharmacy Dena Higbee, MS Higbeed@health.missouri.edu Simulation Center Director, University of Missouri School of Medicine Gretchen Gregory Gregoryg@missouri.edu University of Missouri Sinclair School of Nursing