Download
1 / 72
740 likes | 891 Vues
Explore SEM and TEM techniques, optical microscopy capabilities, and corrective procedures for lens aberrations. Learn about resolution enhancement methods and practical applications in microscopy studies.

E N D
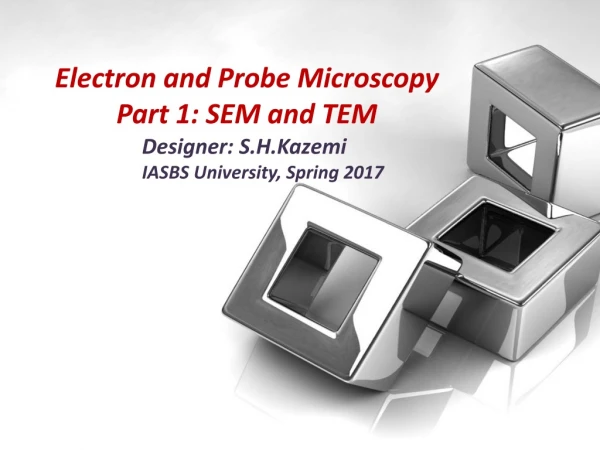
Electron and Probe Microscopy Part 1: SEM and TEM Designer: S.H.Kazemi IASBS University, Spring 2017
AFM OM SAM 1 Å 1 nm 1 µm 1 mm 1 cm SEM STM Resolution Here are some of the techniques we will examine and a comparison of their lateral resolution capabilities.
Optical Microscopy • a diffraction experiment • basic lens components • coarse/fine focus • Mon/Bin/Tri ocular schemes • working distance • adjust interpupillary distance • quantitation with reticle • image recording
imaging with a simple lens 4 12/20/2019
The meaning of focal length 5 12/20/2019
Aberrations of electromagnetic lenses The most important ones to consider are: • Spherical aberration • Chromatic aberration • Astigmatism 6 12/20/2019
spherical aberration Object plane • Arises because a simple lens is more powerful at the edge than at the centre • Is not a problem with glass lenses (can be ground to shape) • Disc of minimum confusion results instead of point focus: • Is not correctable for electromagnetic lenses 7 12/20/2019
Coping with spherical aberration • Disc of minimum confusion has diameter given by: d = C α3 C = constant} • Hence reducing α gives a large reduction in d • But for optimal resolution we need large α ! • Best compromise is with α = 10-3 radians (= f/500) • Gives resolution = 0.1 nm - can not be bettered 8 12/20/2019
Chromatic aberration • Light of different λbrought to different focal positions. • λ for electrons can be controlled by fixed KV and lens currents. • But λ of electrons can change by interaction with specimen ! • Rule of thumb: resolution >= (specimen thickness)/10 9 12/20/2019
Astigmatism minimal confusion • Arises when the lens is more powerful in one plane than in the plane normal to it • Causes points to be imaged as short lines, which ‘flip’ through 90 degrees on passing through ‘focus’ (minimal confusion) 10 12/20/2019
Astigmatism - arises from: • Inherent geometrical defects in ‘circular’ bore of lens • Inherent inhomogeneities in magnetic properties of pole piece • Build-up of contamination on bore of pole-piece and on apertures gives rise to non-conducting deposits which become charged as electron strike them Hence astigmatism is time-dependent and cannot be ‘designed out’ inevitably requires continuous correction 11 12/20/2019
Astigmatism - correction • With glass optics (as in spectacles) astigmatism is corrected using an additional lens of strength and asymmetry opposed to the asymmetry of the basic (eye) lens • With electron optics, same principle employed: 1- Electrostatic Stigmator lens apposed to main lens 2- Strength & direction of its asymmetry user-variable • Only the OBJECTIVE lens needs accurate correction • Correction usually good for 1-2 hours for routine work 12 12/20/2019
When we image a simple point 13 12/20/2019
Q Optical Microscopy Resolution • Rayleigh equation d = 0.61 (l / N.A.) d is distance between objects that can still be distinguished, l is wavelength of light, N.A. is numerical aperture of lens = n sin(Qvertex)
Definition of resolution 15 12/20/2019
SEM - scanning electron microscopy 16 12/20/2019
Electron emitter Scanning Electron Microscopy Electron gun 17 12/20/2019
The electron gun 18 12/20/2019
The electron gun A Wehnelt acts as a control grid and it also serves as a convergent electrostatic lens. The anode is biased to a high positive voltage (typically +1 to +30 kV) relative to the emitter so as to accelerate electrons from the emitter towards the anode, thus creating an electron beam that passes through the Wehnelt aperture. The Wehnelt is biased to a negative voltage (typically −200V to −300V) relative to the emitter, which is usually a tungsten filament or Lanthanum hexaboride (LaB6) hot cathode. The Wehnelt bias voltage creates a repulsive electrostatic field that condenses the cloud of primary electrons produced by the filament. 19 12/20/2019
wavelength & voltage l Wavelength of electrons is determined by the accelerating voltage (V) on the filament from which they are emitted λ= 0.1*(150/V)0.5 (de Broglie, 1924) ) Therefore very high voltages (up to 100 kV) are used to produce small values of And (λ <0.005 nm) 20 12/20/2019
Why high vacuum ? • Mean free path of electrons v short in air - at least 10 -5 mbar usually aimed for • Also - Tungsten filaments burn out in air - Columns must be kept dust free • Achieved by 2-fold pumping: Rotary (mechanical) pump + diffusion pump or using turbo pump 21 12/20/2019
microscope column throat with valve to isolate cooling coils chimney 2 annular vents with jets of oil vapour emitted at high velocity to mechanical pump OIL electrical heater How does a diffusion pump work? 22 12/20/2019
The electromagnetic lens • Works at fixed focal distance & variable focal length - Like the human eye lens, but unlike light optics • Simple rheostat can vary power of lens (varies current) • Electrons also spiral thro’ lens(effect easily observed) 23 12/20/2019
Electron Gun Secondary Electron Detector Vacuum Chamber Scanning Electron Microscopy
Electron microscopy • SEM - scanning electron microscopy • Tiny electron beam scanned across surface of specimen • Backscattered BSE) or secondary electrons (SE) detected • signal output to synchronized display
Scanning Electron Microscopy 27 12/20/2019
Scanning Electron Microscopy Electron gun Don't make x-rays - use electrons directly Wavelength: NOT = hc/E (massless photons) = h/(2melectronqVo) (non-relativistic) = h/(2melectronqVo + q2Vo2/c2)1/2 relativistic = h / (2melectronqVo + q2Vo2/c2)1/2 = 1.22639 / (Vo + 0.97845 · 10-6Vo2)1/2 (nm) & Vo(volts): 10 kV ——> 0.12 Å & 100 kV —> 0.037 Å
Scanning Electron Microscopy = h/(2melectronqVo + q2Vo2/c2)) • Effects of increasing voltage in electron gun: • Resolution increased ( decreased) • Penetration increases • Specimen charging increases (insulators) • Specimen damage increases • Image contrast decreases
SEM Lens Electrons focused by Lorentz force from electromagnetic field F = qv x B effectively same as optical lenses Lenses are ring-shaped Coils generate magnetic field, electrons pass thru hollow center. Lens focal length is continuously variable & apertures control limit beam
SEM- sample preparation Conducting : Little or no preparation attach to mounting stub for insertion into instrument may need to provide conductive path with Ag paint Non-conducting : Usually coat with conductive very thin layer (Au, C, Cr)
Scanning Electron Microscopy Interaction volume Backscattered electrons come from whole volume (high energy) Secondary electrons come from neck only (low energy) 32 12/20/2019
Scanning Electron Microscopy Interaction volume 33 12/20/2019
Scanning Electron Microscopy 34 12/20/2019
Elastically scattered SEM Backscattered e– Inelastically scattered Secondary electron emission SEM Relative Intensity Fraction of Incident Beam Energy Electron Re-emission 35 12/20/2019
BSE vs. 2° Detection Both can be used, different information, different detection scheme. BSE Specular reflection Higher energy Encode some chemical information 2° Electrons Isotropic emission Very low energy Better structural contrast 36 12/20/2019
Scanning Electron Microscopy Specimen-electron interactions What comes from specimen? Backscattered electrons Secondary electrons Fluorescent X-rays high energy compositional contrast Brightness of regions in image increases as atomic number increases (less penetration gives more backscattered electrons) low energy topographic contrast composition - EDS
Schematic of a backscattered electron detector (BSD) for scanning electron microscopy (SEM) a light pipe to carry the photon signal from the scintillator inside the evacuated specimen chamber of the SEM to the photomultiplier outside the chamber The detector consists primarily of a scintillator inside a Faraday cage inside the specimen chamber of the microscope. A low positive voltage is applied to the Faraday cage to attract the relatively low energy (less than 50 eV by definition) secondary electrons. Example: Everhart-Thornley Detector (E-T detector or ET detector)
Scanning Electron Microscopy Backscattered electron detector - solid state detector Electron energy up to 30-50 keV Annular around incident beam Repel secondary electrons with negative biased mesh Images are more sensitive to chemical composition (electron yield depends on atomic number) Line of sight necessary
Scanning Electron Microscopy Secondary electron detector - scintillation detector • Positive bias mesh needed in front of detector to attract low energy electrons • Line of sight unnecessary 41 12/20/2019
Scanning Electron Microscopy Choose correct detector- topography example Fracture surface in iron Backscattered electrons Secondary electrons 42 12/20/2019
Scanning Electron Microscopy Composition - what elements present at a particular spot in specimen? Use solid state detector, and do energy scan for fluorescent X-rays 43 12/20/2019
Image X-ray map Scanning Electron Microscopy Composition mapping - x-ray fluorescence Use solid state detector set for X-ray energy for a particular element in specimen 44 12/20/2019
Scanning Electron Microscopy Contrast Comes from any kind of interaction with electron beam • Topography • Composition • Elements • Phases • Grain (crystal) orientation • Static Charging affects 45 12/20/2019
An SEM example Trochodiscus longispinus in OM and SEM. Note improved depth of field and resolving capability of the SEM experiment.
Another SEM example Changing the Y content in the Ni electrolyte bath from 1 to 5 g/L. Preferential growth directions are altered as the nucleation rates are changed by the co-depositing material.
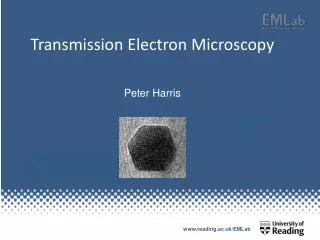
TEM Typical Accel. volt. = 100-400 kV (some instruments - 1-3 MV) Spread broad probe across specimen - form image from transmitted electrons Diffraction data can be obtained from image area Many image types possible (BF, DF, HR, ...) - use aperture to select signal sources Main limitation on resolution: aberrations in main imaging lens Basis for magnification - strength of post- specimen lenses