Download
1 / 38
380 likes | 562 Vues
Think about the motion probe and graphs that we made with our own bodies, and then answer the next few questions…. Which of these graphs show constant speed toward home ?. A. B. C. F. E. D. Which of these graphs show constant speed away from home ?. A. B. C. F. E. D.

E N D
Think about the motion probe and graphs that we made with our own bodies, and then answer the next few questions…
Which of these graphs show constantspeed toward home? A B C F E D
Which of these graphs show constantspeed away from home? A B C F E D
Which of these graphs shows someone running away from home, resting a while, running away from home again, running toward home, walking away from home, running away from home REALLY fast, and then running not quite as fast away from home? A B C F E D
Which of these graphs shows constant acceleration (speeding up) toward home? A B C F E D
Which of these graphs shows constant acceleration (slowing down) toward home? A B C F E D
Which of these graphs shows constant acceleration away from home? A B C F E D
Which of these graphs shows an object at rest? A B C F E D
Which of these graphs shows an object moving at the fastest rate? A C B D
Which of these graphs shows an object moving at the slowest rate? A C B D
Which graph fits this story: Johnny ran away from his starting point, sat down to rest for a while, ran even faster to his friend’s house, and then raced all the way back to the starting point? A B C F E D
Which graph fits this story: A dog was walking slowly along a street UNTIL he saw his master, at which point he turned and started running toward home? A B C F E D
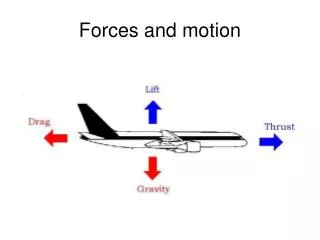
Speed • Distance an object travels in one unit of time
Examples of Speed • 125 miles per hour • 125 m/hr • 125 mph • 20 cm/year • 20 centimeters per year This car is in motion at a speed of 87 miles per hour.
Speed Always includes distance compared to time Example: This car can achieve a speed of 125 miles per hour.
How to calculate speed: • Divide the distance that the object has traveled by the time that it took to travel the distance Distance Speed = Time
Distance Yes, speed = dividedby Time OR Distance Time dividedby OR Distance Time
Let’s practice: • A cheetah chased an antelope across the field for 1 minute. During that time, he covered 5 kilometers. At what speed did he chase the antelope? • Speed = Distance / Time = 5km / 1minute = 5km / min
Let’s practice: • It took an ant 4 minutes to walk 40 meters. At what speed did he walk? • Speed = Distance / Time = 40 meters / 4 min = 10 m / min
Let’s practice: • It took a ball 60 seconds to roll 360 meters. At what speed did it roll? • Speed = Distance / Time = 360 meters / 60 sec = 6 meters per second
Constant Speed • Unchanging speed • Speed that remains the same • Speed that remains fast, not changing • Speed that remains slow, not changing
Which car is moving at a Constant Speed? Go here to find the animation of three cars in a box. Can you tell which cars are accelerating and which car is moving at a constant speed? http://www.glenbrook.k12.il.us/gbssci/Phys/mmedia/kinema/acceln.html The red car is moving at a constant speed.
Judging from this graph, when did the car remain at rest? Can you see that the speed remained at 25 miles per minute from 5 – 7 minutes; so the car is not moving.
Average Speed Usually objects do not move at a constant speed; instead, they keep changing their speeds. Imagine yourself riding a bike ride to a friend’s house. You’d keep changing speeds as you rode to his/her house, wouldn’t you? What if I asked the speed that you traveled to your friend’s house? You couldn’t answer just one speed; you’d have to answer many different speeds. Well, I wouldn’t want to hear all of the speeds, I’d just want to know your average speed. How would you calculate average speed? You’d do it like this…
In a graph, this would be the total (or ending) time. Total (Ending)Distance Average Speed = Total (Ending) Time Or you could write it this way… Total Distance Total Time Average Speed =
Quiz Yourself: Can you spot constant speed, acceleration, and average speed? Go here to find the animation of a purple car moving along a 5-mile track that includes a stop light or two.http://www.glenbrook.k12.il.us/gbssci/Phys/mmedia/kinema/trip.html Study the purple car closely. Can you tell that its speed keeps changing? It is true; this car’s speed is NOT constant. We won’t be able to find the constant speed of this car, but we will be able to find the AVERAGE SPEED of this car. We calculate averagespeed exactly the way the we calculate constantspeed: by dividing the distance that the object traveled by the time it took to travel that distance. Find the average speed of the purple car.
Check this graph again. Is the car moving at a constant speed? No. We can only find the average speed. Find the avg. speed up to 5 min. What about 2 min? Up to 5 min, speed = 5mph Up to 3 min, speed = 4 mph
In the following slides, you will use tables to discover data about speeds: • The answers are at the bottom of each slide.
Try this sample test question: According to the tables below, which caris traveling at a constant speed? Look for the patterns! Motion of Car A Motion of Car B Idea from: http://www.physicsclassroom.com/mmedia/kinema/trip.html CarAB
Try this sample test question: According to the tables below, which caris traveling at a constant speed? Look for the patterns! Motion of Car A Motion of Car B Idea from: http://www.physicsclassroom.com/mmedia/kinema/trip.html Car B
Try this: According to the table below, what is the average speed of the car at 1 second? 2 seconds? 3 seconds? 5 seconds? Motion of Car A Answers: 4 m/s 4 m/s 3 m/s 7 m/s Idea from: http://www.physicsclassroom.com/mmedia/kinema/trip.html
According to the graph below, which biker traveled at an average speed of 5 m/sec? Answer: Biker 1
According to the graph below, what is the average speed of Biker 3? Answer: 6 meters/sec
How is the speed (distance/time) of an object graphed? • We use a _ _ _ _ graph, since we are showing how one o _ _ _ _ _’s distance is changing over _ _ _ _. • On the x axis is the _ _ _ _ that the object was in motion. • On the Y axis would be the _ _ _ _ _ _ _ _ that the object traveled during that time. Remember DRY MIX D T
How is the speed (distance/time) of an object graphed? • We use a line graph, since we are showing how one object’s distance is changing over time. • On the x axis is the time that the object was in motion. • On the Y axis would be the distance that the object traveled during that time. Remember DRY MIX D istance on Y T ime on X
According to the graph below, what is the average speed of Biker 2 up to three seconds? D T Answer: 2 meters/sec
Congratulations! You're ready for the test!