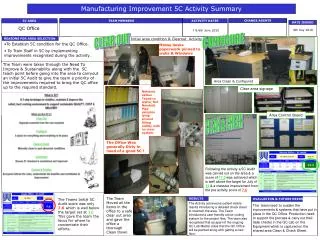
Masterclass Activity Summary
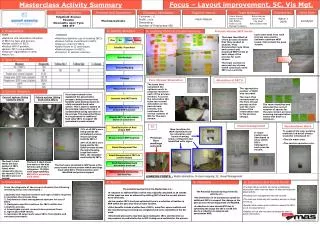
Masterclass Activity Summary. Focus – Layout improvement, 5C, Vis Mgt. Company Address. Products and Customers. Issue Date. Pharmaceuticals. Company Information. Turnover : £ Profit : n/a Ownership: Number of Employees:450. Mark McGurk. Engineer Names. Team Members. Contract No.

Masterclass Activity Summary
E N D
Presentation Transcript
Masterclass Activity Summary Focus – Layout improvement, 5C, Vis Mgt. Company Address Products and Customers Issue Date Pharmaceuticals. Company Information Turnover : £ Profit : n/a Ownership: Number of Employees:450 Mark McGurk Engineer Names Team Members Contract No. Diane Storey Daniel Stokes Dan Billany Keith Currie Michael Hodgson Edgefield AvenueFawdonNewcastle upon TyneNE3 3TT Wave 1 2009 Robin Barras Janice Hurst Tim Scott Steve Eaton-Hall 22/06/09 TEAM 1. Expectations 5. Activity Structure Process stream WIP levels 6. Learning Points & Countermeasures Cycle time data from each process was used to estimate optimum WIP levels, this include the para stream. COMPANY The team identified all of the process streams that they needed to analyse. They documented cycle times and current and proposed WIP levels at each stage of the process for each stream. The team worked on para and any stream which used buck valve IBC’s as a priority. • Optimise and rationalise utilisation of IBC’s by type and process. • Better control of IBC’s • Reduce WIP if possible. • Ensure IBC’s are available. • Improve organisation in area. • Have Fun. • Maximise/optimise use of existing IBC’s • Reduce further investment in IBC’s. • Improve control of IBC’s. • Upskill team in CI techniques. • Method/system for IBC’s. • Precursor to witness exercise. Plan Do Check Action Identify Focus Area Data Analysis 2. QCD 7 Measures Process Mapping Create a Plan 7 Wastes Para Stream Simulation Allocation of IBC’S The team then calculated the optimum work in progress levels for each of the process streams. To prove the calculation the team ran a small simulation on the para stream process, this confirmed the correct number of IBC for the para stream. Map process streams The appropriate number of IBCS was recorded. The team then concentrated on the Para stream process as this was the main focus of the intervention due to the process change. 3. Current Situation As an improvement to the equipment the paracetamol process is being converted from butterfly valve docking station to a fully automatic buck valve system. This is superior system as the principle reduces the risk of contamination during operation of the process. This means that there is a requirement for additional buck valve IBC’s to support the paracetamol process stream. Current system (Using butterfly IBC’s) Future system (Using buck valve IBC’s) Calculate ideal WIP levels The team identified and allocated the correct number of spaces for the para stream process ensuring transportation waste was kept to a minimum. Run simulation to check para stream WIP is correct Allocate IBC’s to each steam based on calculations Visual management Standardised Work 5C Identify location of Para stream WIP New locations for WIP identified from bin allocation and layout drawing. Areas configured and identified with signs. 21% of all IBC’s were being used by the paracetamol process stream (all large butterfly IBC’s.) 19% of all IBC’s were being used by the Epilim process stream, the majority being Large buck valve IBC’s, the remainder small butterfly IBC’s. • To support the new working methods Job detail sheets would be introduced in:- • The bin wash area. • The service operators role. A visual system was developed to show which IBC’s belonged to each process stream. 5C para stream WIP locations Previous floor markings removed. Visual Management Plan Visual Management of IBC’s to process stream The level 1 chart shows the total number of IBC’s found, when compared to the on-site records 7.5% of the IBC’s were not located. The level 2 chart shows how many of the bins fall into each of the 5 categories:- 70 (38% were large butterfly), 45 (24.5% were large buck valve) Draft Standardised work documents produced The team were interested in WIP levels in the para process and any process which used large buck valve IBC’s. These processes were identified and process mapped. Review Activity and Develop Roll Out Plan LEARNING POINTS: - Waste elimination, Process mapping, 5C, Visual Management. 4. Focus Area 7. Results 8. Financials 9. Evaluation and Future Needs From the diagnosis of the current situation the following workshop focus was developed :- 1Quantify the required number and type of IBC’s required to maintain the process flow. 2. Implement visual management systems for use of IBC’s 3. Designate specific locations for IBC’s within the complete process. 4. Investigate current versus future process flows. 5. Agree para WIP levels. 6. Generate 20 large buck valve IBC’s from Epilim and non-para processes. • The team did an excellent job during a challenging intervention which was very heavy on data and classroom based activity. • Feedback from management was well received. • The team are continuing with meetings and are on target to free up. • Regular team reviews must continue to ensure the IBC’s are at the required level. • Detailed roll out plan has been developed by team to assist intervention. • The potential savings from this Masterclass are :- • A reduction in additional IBC’s which was originally calculated as 20 outside of this team can now be achieved by utilising IBC’s from the current process more efficiently. • As the number IBC’s has been optimised there is a reduction of batches in WIP within the para and other process streams. • Other benefits include a better flow of IBC’s, more floor space available and the manufacturing area being less congested and more availability of the bin wash. • This should also lead to less time spent looking for IBC’s and therefore an improvement in productivity due to IBC’s being more available for the process. • The Potential financial savings from this activity are :- • The elimination of an unnecessary spend for additional IBC’s to support the change on the para process stream equipment of £420,000. • A reduction in para stream WIP due to optimising the usage the IBC’s of £68,755 due to a reduction in pangran and paracodeine WIP.
Expectations and 7 Measures Team Expectations Optimise and rationalise utilisation of IBC’s by type and process. Better control of IBC’s Reduce WIP if possible. Ensure IBC’s are available. Improve organisation in area. Have Fun. Company Expectations Maximise/optimise use of existing IBC’s Reduce further investment in IBC’s. Improve control of IBC’s. Upskill team in CI techniques. Method/system for IBC’s. Precursor to witness exercise. Return to A3 Summary
Current Situation and Focus Para-stream Feed system Future system (Using buck valve IBC’s) Current system (Using butterfly IBC’s) Buck valve IBC is an automatically actuated valve that is controlled by the process. Butterfly valve IBC uses a manually operated valve which the operator must actuate A cradle must also be used to enable the IBC to connect with the docking station Buck valve IBC mates directly to the docking station ready for the process to actuate the valve. As an improvement to the equipment the paracetamol process is being converted from butterfly valve docking station to a fully automatic buck valve system. This is superior system as the principle reduces the risk of contamination during operation of the process. This means that there is a requirement for additional buck valve IBC’s to support the paracetamol process stream. Butterfly valve IBC is then positioned over the docking station and the valve actuated. Return to A3 Summary
Current Situation The number of IBC’s was then analysed by type and process to identify the quantity and type of IBC allocated to each process. A complete count of all the IBC’s within the process was conducted and this was then used to identify the current situation. The level 2 chart shows how many of the bins fall into each of the 5 categories:- 70 (38% were large butterfly), 45 (24.5% were large buck valve) 21% of all IBC’s were being used for paracetamol and they were all large butterfly IBC’s. 19% of all IBC’s were being used by the Epilim process stream, the majority being Large buck valve IBC’s. The level 1 chart shows the total number of IBC’s found, when compared to the on-site records 7.5% of the IBC’s were not located. The team were interested in WIP levels in the para process and any process which used large buck valve IBC’s. These processes were identified and process mapped. Return to A3 Summary
Current Situation SUMMARY SUMMARY SUMMARY T (secs) T (secs) T (secs) Dist (m) Dist (m) Dist (m) OP OP OP INSP INSP INSP TRANS TRANS TRANS DELAY DELAY DELAY STOR STOR STOR Total No. Total No. Total No. 6 4 13 2 1 0 25 10 11 8 11 6 1 1 1 Total Time. Total Time. Total Time. 1780 9015 1760 5 15 55 253 60 8390 7460 14998 60 0 0 Grand Total. Grand Total. Grand Total. 9305 24266 10220 747 2930 1205 Percentage. Percentage. Percentage. 19.1 17.2 37 0.1 0 0.1 1 0.5 0.6 80.2 62 82.2 0 0 0 82.2 62 80.2 The data from the physical IBC count lead the team to identify how many IBC’s were in the para process, this was process mapped to identify delays and waste. The data also identified which processes were using the required buck valve IBC’s, these processes were mapped to identify opportunities for releasing IBC’s. High percentages in non-value added activities (delay) Saw tooth identifies that material is being transported from one delay to another delay instead of directly to operation.
Workshop Focus From the diagnosis of the current situation the following workshop focus was developed :- 1. Quantify the required number and type of IBC’s to maintain the process. 2. Implement management systems for use of IBC’s. 3. Designate specific locations for IBC’s within the complete process. 4. Investigate current verses future process flows. 5. Agree para stream WIP levels. 6. Generate 20 large buck valve IBC’s from Epilim and non-para processes. Return to A3 Summary
Countermeasures :- Process stream analysis Process Data Cycle time Shift Pattern Moisture test required to determine route Observed WIP Predicted WIP Predicted weekly demand Blending operation required Acceptable process range Preferred range To gain a better understanding on the process stream and WIP level requirements the process streams were mapped Within the para stream process the team identified a moisture test. This determines whether the base grain will go to pangran or paracodeine processes. This was thought to be a major issue when the team analysed the data virtually all of the product could be used for either process.
Countermeasures :- Ideal para stream WIP level P A D C Do:- Calculate optimum WIP levels. Plan:- Each process stream was isolated. From this ideal WIP levels were calculated for each process. Act:- Once WIP levels were verified to be ok the team then had to identify where to place the required WIP using 5C. Check:- Run a simulation to check that WIP levels are ok and start condition is reached at end of cycle. Each team member was designated a process and a scale of 2 secs = 1 hour was used, a weekly cycle of 105 hours was ran
Countermeasures :- 5C After all the WIP levels within each process stream had been analysed and the optimum levels calculated and simulated the team proposed an allocation for buck valve IBC’s. • The spaces for the para-stream IBC locations was identified on a layout. • The team considered:- • Keeping the Distance travelled to a minimum. • Ensuring the flow of material was good. After optimisation the team identified that there would be 6 spare IBC’s. The optimum level for para stream was 14, 6 less than the 20 originally estimated by the company. IBC’s moved to newly configured locations. Visual locations identified on area walls. New locations configured from layout. Old locations removed. New locations configured next to processes. PARA –STREAM FEED FLOOR. Return to A3 Summary
Countermeasures :- Visual Management Action sheet for identifying if a bin is swapped or some of the spares are required due to stock building etc. Process stream allocation monitor, this show which IBC’s are allocated to each individual process stream Identification tag for each IBC to identify which process stream it belongs to.
Results and Financials • Results • The savings from this Masterclass are :- • A reduction in additional IBC’s which was originally calculated as 20 outside of this team can now be achieved by utilising IBC’s from the current process more efficiently. • As the number IBC’s has been optimised there is a reduction of batches in WIP within the para and other process streams. • Other benefits include a better flow of IBC’s, more floor space available and the manufacturing area being less congested and more availability of the bin wash. • Financials • The financial savings from this activity are :- • A reduction in capital investment in buck valve IBC’s which was originally allocated as £420,000 has been reduced to £0 = £420,000 saving. • Estimated reduction in paracetamol stock from £59,824 to £26,173 = £33,651 saving. • Estimated reduction in paracodeine stock from £87,760 to £52,656 = £35,109 saving. • Total potential savings from activity = £488,660. Return to A3 Summary
Evaluation and Future Needs • The Team did an excellent job during a challenging intervention which was very heavy on data and classroom based activity. • Feedback to management was well received. • The team are continuing to have regular team meetings and are on target to free up the required number of IBC’s required. • Regular team meetings must continue to ensure the IBC’s are available when the new para stream system goes live. • A detailed roll out plan has been developed by the team to assist the intervention and ensure key activities have been completed by critical dates. • This activity is now live and the team have exceeded the estimated reduction in IBC’s to approx. 12 Return to A3 Summary