Download
1 / 30
300 likes | 462 Vues
Fresh Produce Marketing Trends and Issues for California Blueberry Growers by Dr. Roberta Cook University of California Davis Dept. of Agricultural and Resource Economics May 2003 UC Kearney Ag Center. Overview of Presentation. US blueberry situation Production Trade Consumption

E N D
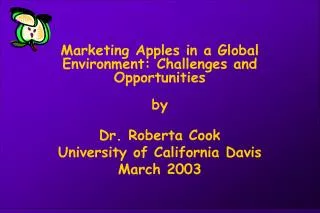
Fresh Produce Marketing Trends and Issues for California Blueberry Growers by Dr. Roberta Cook University of California Davis Dept. of Agricultural and Resource Economics May 2003 UC Kearney Ag Center
Overview of Presentation • US blueberry situation • Production • Trade • Consumption • Shipping seasons • Marketing issues • Consolidation • Changing procurement patterns
N. American Production of Blueberries, Fresh and Processed, 1998-2002 In 1000 Pounds 389,900 288,809 Lowbush * Highbush *Production problems in Quebec caused one year decline in lowbush Source: US Highbush Blueberry Council
Blueberry Industry Snapshot • Production was about 250 million pounds in 1991, including almost 150 million pounds for highbush • In 2002 57% of production was highbush, vs. 64% in 1998 • But 1998 was a low production year for lowbush (almost 50 million pounds <normal) • Almost all lowbush is sold frozen/processed, but some diversion to fresh based on market conditions may occur • Just under half of N. American production is sold on the fresh market
Blueberry Industry Snapshot • 2003 and beyond N. American total production is projected to be around 450 million pounds (may be overly optimistic) • California produced 800,000 lbs. in 2001 and 2 million in 2002, all fresh • Ca. has a .9% share of the 2002 N. American highbush production volume; about a 2% share of fresh highbush production • REMEMBER, THIS PUTS CA. IN A WEAK MARKET POSITION RELATIVE TO MOST OTHER CROPS WE GROW HERE
U.S. Highbush Blueberry Production (1000 lbs.), Change ’98 to ‘02, and Selected State Shares 2002 State Shares % 98-02 State Production 02 98 % Change Michigan/Indiana 66,500 30 28 28 New Jersey 40,000 18 19 11 B. Columbia 34,000 15 18 0 Oregon 26,400 12 12 15 N. Carolina 15,500 7 8 9 Georgia 14,000 6 4 87 Washington 13,000 6 6 24 Others 13,800 7 4 79 Total 223,200 100 100 21 Source: US Highbush Blueberry Council
U.S. Fresh Blueberry Production Rankings, by Selected States – FRESH VS. TOTAL PRODUCTION RANKINGS DIFFER State Ranking New Jersey 1 Michigan/Indiana 2 B. Columbia 3 N. Carolina 4 Oregon 5 Georgia 6 Washington 7 Mississippi 8 Florida 9 (production of 3.4 million pounds in 2001 and 2.1 in 2002) Source: US Highbush Blueberry Council
Blueberry Shipping Seasons • California’s May-June season overlaps with: • Fla., April to mid-June • N. Carolina, May 10-July 1 • Georgia, May 25-July 10, but S. Georgia earlier • Arkansas, May 20-July 10 • New Jersey, June 10-Aug. 15 • Mich./Indiana and Wash./Oregon come in June 25; Mich ends Sept. 10 and goes thru Oct. with CA • ---------------------------------------- • BC, July 15-Aug. 25 • Chile, Nov. thru April Can Ca. also target a fall window? (some say yes, in the desert and the south coast)
Blueberry Pricing • During California’s May-June season: • $16-18 for 4.4 oz. flats (3.5 lb. net carton weight) right now – mid-May 2003 • Next week when more S. Eastern volume comes on may be down to $12 • May prices generally range between $10-20/flat • Early June prices tend to be in the high teens for 9-10 lb. pint flats (box size increases as volumes increase) • As New Jersey comes in prices often get down to $12 by the third week of June • BUT, THESE PRICING LEVELS WILL DECLINE AS PRODUCTION GROWS!
Estimated 2003 Ca. Blueberry Area • 818 commercial acres • Additional area destined for Farmer’s Markets by small growers (Ca. has over 300 Farmer’s Markets) • Total area likely to be around 1000 acres
Fresh Blueberries: U.S.Highbush Estimated Fresh Production and High and Lowbush Fresh Imports & Exports Thousand Pounds Sources: DOC, USHBC 2000 2002 1998 Note: 90% of US exports go to Canada, 9% to Japan
Fresh Strawberries: U.S. Fresh Production and Fresh Imports & Exports Thousand Pounds Source: USDA, ERS 2000 2001 1998
Monthly US Imports of Fresh Blueberries by Country of Origin in 2002 1000 Pounds Source: US DOC
Selected Blueberry Trends in Seasons Competing with Ca. • Central-North Florida: April 10 – May 15 window • Estimated additional 100+ acres of high density to be planted in next year or so • South Georgia: April 15 – May 15 window • 2002 Estimated additional 400 acres of southern high bush was planted, 300 acres in high density • High density – 3-4000 plants/acre • Regular density – 1000+ plants/acre • 2003Some reluctance to continue planting due to the price/return outlook for the long run • Projected 180,000 4.4 oz. flats in 2003, reaching 400,000 in 2006 Source: Industry Expert
US Per Capita Utilization of Fresh Strawberries and BlueberriesE Pounds NA .41 EEstimated Sources: USDA; Dr. Roberta Cook
US Per Capita Utilization of Fresh Pears, Table Grapes, Apples and Strawberries Pounds Apples Grapes Strawberries Pears Source: USDA/ERS
US Per Capita Utilization of Cherries, by Product Form, 1977-2001 Source: ERS, USDA
Ave. Item Number in the Ave. US Fresh Produce Department 400 350 350 300 250 173 200 150 100 50 0 Pma study: 574 SKU’s in 2001 Number of items Source: Supermarket Business, Oct. 1999 and Progressive Grocer Oct. 2002 1987 2001
USPER CAPITA FRUIT CONSUMPTION, POUNDS 1977-2001 273 269 90 118 85 Pounds per capita 71 24 26 74 54 Total for 2001 reaches 279 including some berries and olives. Source: USDA/ERS, Oct. 2002
US Chains: Impact of Retail Consolidation on The Buying Process • Multiple buying offices now merging into fewer or one • Purchase from shipper without seeing the product • More emphasis on standards, less on price • Synergy contract buying • More emphasis on forward planning • Buy more directly from shippers Sources: PMA Fresh Track 2001; Cook and misc.
US Chains: Impact of Retail Consolidation on The Buying Process -Ahold – ending Division buying, centralizing to 2 or 3 preferred suppliers chain wide -Safeway – centralizing merchandising to Pleasanton, Ca. buying to Phoenix -Kroger – consolidating divisions and centralizing buying to Cincinnati
1 2 3 4 5 100 ... Produce Business Model 1960 to mid-90s: “Distribution-Based Strategy” • Commodity Approach Uniform offers. Focus on food ads to boost short-term sales, respond to inventory issues. Relationship selling. Fight for best position. Exploit seasonality. Retailer or Wholesaler Fax Machine Marketing Source: Adapted from The Perishables Group
New Produce Business Model, 1998… • Suppliers • Retailers know the • value of ads, space, • location, etc. • Expect suppliers • to know consumers: • Right product • Right stores • Right time • Right price KeyPartner KeyPartner KeyPartner 1 2 … … • New Strategy--Cover Both • TRADITIONAL “A” RETAILERS • Bid for orders. • Buy ads, fight for space. • Tactical approach. • NEW MODEL “B” RETAILERS • Consumer Information. • Category Expertise. • Category Development. Source: Adapted from The Perishables Group
Sales mechanisms for eachmarketing channel –1994 & 1999 - % Grapes, oranges, grapefruit and CA/FL tomatoes Mass Mass All All Retail Retail Merch Merch 1994 1999 1994 1999 1994 1999 Sale Type Daily Sales 72 58 57 43 20 7 Advance Sale 19 24 30 42 19 23 Sht-t. Contract 7 11 12 11 48 41 Lng-t. Contract 2 7 1 4 13 29 Source: Economic Research Service, Produce Marketing Study Interviews 1999-2000
Types of Fees & Services Requested Slotting EDI Volume Rebates Displays Non-volume Rebates Private Labels Promotional Ads Returnable Containers E-commerce fees Special Packs Capital Improvement Food Safety Certification
Fees are increasing for all fresh produce but commodities are still different • Commodities • No slotting fees • Other fees well under 2 percent of sales • Volume incentives, promotional allowances and rebates • Fresh-Cut • All fees approximately 1 to 8 percent of sales • Slotting fees, promotional allowances, volume incentives, and rebates – firms offer options • Can cost up to $2 million to acquire the business of a national chain; $500,000/division: stimulating Private Labels
WHAT aDOLLAR SPENT forFOOD PAID FOR in 2001 in the USA Labor - 38¢ Packaging - 8.0¢ Pre-tax profits - 4.5¢ Transportation - 4.0¢ Business taxes - 3.5¢ Depreciation – 3.5¢ Advertising - 4.0¢ Other costs - 4.0¢ Interest - 2.5¢ Repairs - 1.5¢ Energy - 3.5¢ Rent - 4.0¢ 19¢ Marketing bill 81¢ Farm value 19¢ Source: Howard Elitzak ERS/USDA
Category Development Best Practices Store-level Research Purchase Triggers Consumer Drivers Long view • Boards/Commissions • Retailer/ Wholesaler • Grower/Shipper Building Retail Partnerships • Roles and Responsibilities • Effective Tactics • Shopper Savvy Loyalty Card Better Systems • Results-driven Tracking Focus • Dept. Profitability • Strategic Approach • Fact-based Selling • Innovative Marketing/ Merchandising • Efficient Practices • “Category” vs. “Item” Perspective Source: Adapted from The Perishables Group
Conclusions • While retailer buying power is increasing, partly expressed in new demands for fees and services, the huge physical volumes they now procure also make them even more dependent on shippers for stable, consistent yr-rd volumes • This may limit the exercise of market power in the fresh produce sector
CONCLUSIONS: The Future? • More and more, large year-round grower-shippers may become the sourcing entities for retailers, procuring volume above and beyond their own via geographic diversification, including imports. • Smaller seasonal players will need to find niche markets. • SELECT YOUR MARKETER WELL!!