Download
1 / 25
250 likes | 476 Vues
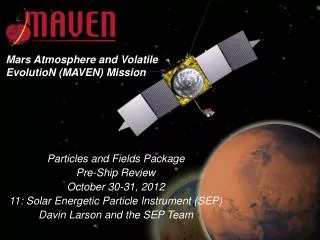
Mars Atmosphere and Volatile EvolutioN (MAVEN) Mission. Particles and Fields Package Pre-Ship Review October 30-31, 2012 11: Solar Energetic Particle Instrument (SEP) Davin Larson and the SEP Team. SEP Status. Environments and Calibration Complete No Outstanding Issues - All PFRs Closed

E N D
Mars Atmosphere and Volatile EvolutioN (MAVEN) Mission Particles and Fields Package Pre-Ship Review October 30-31, 2012 11: Solar Energetic Particle Instrument (SEP) Davin Larson and the SEP Team
SEP Status • Environments and Calibration Complete • No Outstanding Issues - All PFRs Closed • >500 Failure-Free Operational Hours inside PFDPU (for both SEPs) • ~300 more hours outside PFDPU • Ready for Delivery
Environmental Testing History • Environmental Testing (2012): • EMC tests (August – passed) • Required waiver for ~100 kHz range • SEP Pre-Vibe Magnetic Characterization (9/05 passed) • SEP Vibration testing (9/07 passed) • SEP post-Vibe Magnetic Characterization (9/10 - passed) • SEP Enters Thermal/Vac Chamber (9/12 - This was done in parallel with PFDPU T/V) • SEP Thermal/Vac Tests end. Removed from chamber (9/25 - passed) • Non-conformance on opening of SEP2 Actuator. Visual inspection showed incomplete (~90%) opening at lowest temperature and Voltage<32V. Does not impact science. • SEP post-Thermal Vac Magnetic Characterization (9/27 – passed) • SEP Final calibration with PFDPU (10/23 – Completed)
Magnetics Testing • Magnetic characterization was performed on each sensor unit Dipole and Quadrupole moments are computed at 30 cm distance. • Done before and after each Environmental test (Vibe and TV). • Magnetically noisy room with unpredictable transients of 10-30 nT. • Purpose: • Meet magnetic cleanliness requirements. • Magnetic field at 4.5 m distance is determined from extrapolation of near field measurements. • Insure that magnets have not broken or shifted as result of testing. • Pass/Fail: • No significant change in dipole or quadrupole moments. • Field at 4.5 meters <1nT
Magnetic moments trending *A m2 / A m3 divide all values by 100 • Minor shifts occurred in the dipole moments. • Negligible shifts in the quadrupole moments. • Later determined post-vibe setup slightly misaligned due to small flexure of aluminium bench.
SEP 1 (S/N 3) Pre-vibration - example Note color scales are not identical
SEP 1 (S/N 3) Pre-vibration Post-TV Pre-Vibe Post-Vibe SEP1 SEP2 Note color scales are not identical
Summary: SEP magnetic testing • Mechanical state of the magnets: • Minor shifts in magnetic moments can be attributed to uncertainties in measurements and post-vibe test setup slight misalignment. • No evidence of magnets breaking or shifting substantially. • Magnetic cleanliness concerns. At 4.5 m: • SEP 1: 0.04-0.09 nT • SEP 2: 0.03-0.08 nT • Both sensors easily meet < 1 nT requirement. • Final dipole and quadrupole numbers provided to EMC committee.
Vibration Test Pass Criteria – All Met first natural frequency is greater than 80 Hz pre/post sine sweeps agree (within 3% in frequency and 30% in amplitude) entire test protocol is run to completion unit experiences no catastrophic structural failures Post-Vibe Attenuator Mechanism Functional Test Post-Vibe Comprehensive Performance Test (CPT) Post-Vibe Magnetic Characterization
Vibration TestSummary of Results SEP SN 03 SEP SN 04
Vibration Test Test Anomaly • One force transducer on SEP SN 4 was found to be rotated 10 deg. CW • Believe to have happened during assembly because mounting screw was still torqued • Force transducer data valid because Cos10° = 0.98
Mass Properties *MICD Coordinate System *MICD origin : Concentric with the mounting hole at the back of the support structure, at the base of the Thermal Spacer.
Thermal Vac Overview • Due to fortuitous scheduling circumstances (i.e. passing vibe on first try) the SEP sensors and SEP DAP board (in DPU) could be run in parallel in side by side T/V chambers • This allowed simultaneous flight-like configuration testing of SEP Sensors and DAP
SEP Testing Temperatures *Operational eater set-point at -45°C, survival set-point at -55°C, and tested at 26V and 35V
SEP Thermal Vacuum Test • Performed 8 cycles, 1st cycle was thermal survival. Heaters were tested. Thermal balance was performed after cycle 8. At least 4 hour dwell durations. • CPT performed at 1st cycle, 5th cycle and post bake-out. LPT performed at all other times
Full calibration of flight unit performed in B20 cal chamber took place after Vibe and T-VAC No change in x-ray response observered before and after environments All Level 3 Requirements verified in ~1 week test Exposed to: 25- 45 keV Ions* 0 – 35 keV electrons Am241 59.5 keV x-ray source Am241 5.5 MeV alpha source SEP Calibration Reference: MAVEN_PF_TR_011_SWIA_CALIBRATION
PF78: SEP shall measure energy fluxes from 10 to 1e6 eV/cm2-sec-ster-eV • Using calculated geometric factor (0.18 cm^2ster / 64) • High flux limit corresponds to rate of 2800 cnt/s sec • Verification: Ion flux was adjusted to high levels to verify ability to count at >30000 cnt/sec. (Verified)
SEP Ion Response SEP1AFlux900 Å aluminium, 200 Å dead silicon Einc Elost Modeled keV Emeasured 25 10.382974 10.2 30 10.851011 10.7 35 11.598116 11.6 40 12.101942 12.2 45 12.402292 No Calc
SEP Electron Response Response to Electrons Ramping electron gun from 0 to 40 keV Electron detection threshold is 14 keV Efficiency exceeds 90% for energy > 20 keV
SEP Flux Intensity Accuracy Requirement • Level 1 Science requirement: Determine flux to within 30% for Ions (> 50 keV) • Count Rate = Flux x efficiency x Geometric Factor x dE • J(E) = R(E) / ( eff(E) x G x dE(E) ) • dE(E) is determined by the Look UP Table (LUT) that bins the data. 1 bin = 1.46 keV. Variations (between channels) is ~2% but the value for each channel is known to much better than 1%. • G [0.26 cm^2-ster] is a function of geometric optics only – (active detective area, Collimator solid angle. This is calculated using GEANT4. Eventual estimated uncertainty <5% • R(E) [Cnts/sec]: Uncertainty determined by Poisson statistics: sqrt(N)/N. Need > 100 Cnts to attain 30% accuracy. • Efficiency: This is the efficiency of detection which is 1 for Energies well above threshold but approaches 0 within a few sigma of threshold. MeasuredElectronic threshold is ~10 keV. Energy lost in (1000 A) dead layer is ~17 keV. RMS Noise level is 2 keV. Flux uncertainty is typically dominated by efficiency uncertainty for particles near threshold. SEP threshold/noise performance is so far below requirements that this uncertainty is no longer significant. The next dominant unknown is from calculation (~5%) Transmitted Energy of 40 keV proton through 1000A Al is 23keV. Since this is 6 sigma above the threshold level. The quantum efficiency is effectively 1 with negligible uncertainty. (1 sigma noise = 2 keV) Conservative 1000 A Measured Electronic Threshold
End of presentation Backup slides
SEP Geometric Factor d • Rectangular field of view: consider x,y separately • Determine opening angles (x),(y) as a function of position on the detector. • Integrate across the detector in x and y. • Geometric factors: • 0.179 cm² st (open side) • 0.174 cm² st (foil side) • GEANT4 simulations underway to fully characterize detector response. θ(x) c x = 0 a a
Power .101 A @ 28 Volts (includes both DAPs, sensors and P/S efficiency) Sensor Mass S#3 735 gm S#4 749 gm SEP Resources Ready to Fly!