Download
1 / 15
150 likes | 329 Vues
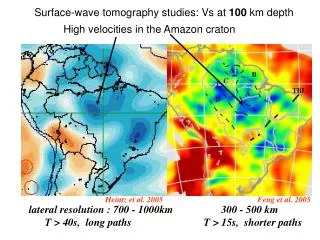
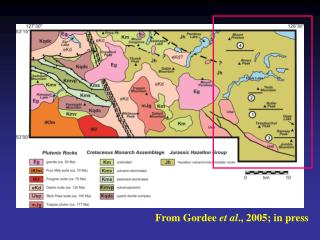
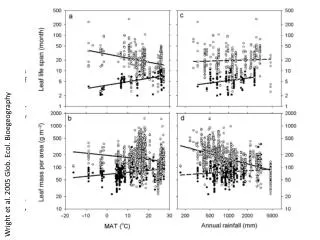
Surface-wave tomography studies: Vs at 100 km depth. High velocities in the Amazon craton. Heintz et al. 2005. Feng et al. 2005. lateral resolution : 700 - 1000km 300 - 500 km T > 40s, long paths T > 15s, shorter paths.

E N D
Surface-wave tomography studies: Vs at 100 km depth High velocities in the Amazon craton Heintz et al. 2005 Feng et al. 2005 lateral resolution : 700 - 1000km 300 - 500 km T > 40s, long paths T > 15s, shorter paths
Note low-velocities beneath the Chaco/Pantanal basins. % S-wave anomalies at 150km (Heintz et al., 2005)
150km 100km Global tomography (Univ. Colorado) Few stations in South America, very long paths -> low resolution (does not isolate Amazon craton Note low-velocities beneath the Chaco/Pantanal basins. 250km 200km Upper Mantle Shear Velocity Model N.Shapiro Univ.Colorado SDT (diffraction tomography model).
Vs 100 km Separate high-velocity block in Southern S.Francisco craton. Joint inversion results: Generally high velocities In the Amazon craton. No clear separation between the Guyana and Guaporé shields. Possible cratonic block beneath the Paraná basin?
Vs 150 km resolution 300-600km thickest lithosphere in oldest block A TransBrasilian Lineament: generally low velocities or limits high velocity blocks.
Vs 200 km oldest rocks resolution 500-800km 2.9-3.0 Ga granitoids/greenstones Carajás Iron Province
150 km Guaporé shield NW SE Guyana shield S.Francisco craton
P-wave tomography station craton intrusion 85-60 Ma intrusions 130-120 Ma, Atlantic rift
geochemistry (Gibson et al., 1997) Note striking similarity of lithospheric thicknesses (geochemistry model) with P-wave anomalies along the white line (200km depth) effect of ray paths tomography (BLSP, 2004)
Seismicity Earthquakes tend to occur above low-velocity areas (thinner lithosphere?)
lithosphere/asthenosphere limit? Number of earthquakes along NW-SE profile (+- 100km width) mag>3,5 Iporá S.Mar/plat. SFC APIP
Teresina station Vp/Vs = 1,71 Crustal thickness = 40 km (assuming Vp=6.4km/s)
33 km 46 km 46 km 33 km 35 km Crustal thicknesses from receiver functions. Note thick crust in the low-topography Paraná basin.
Crustal thickness constrained by 1- Rayleigh waves 2- receiver functions 3- isostasy Feng et al.(2005)
Average crustal Vp/VS ratio 1.74 1.76 Archean is generally more felsic, consistent with low Vp/Vs (<1.73). Mafic rocks, in general, have Vp/Vs >1.75, consistent with Magmatic Arc. 1.71 1.70 1.74 1.73 1.71 Assumpção et al., 2004)


![DACODA [Crandall et al.; CCS 2005]](https://cdn2.slideserve.com/4483408/dacoda-crandall-et-al-ccs-2005-dt.jpg)


![DACODA [Crandall et al.; CCS 2005]](https://cdn5.slideserve.com/9294546/dacoda-crandall-et-al-ccs-2005-dt.jpg)