Water Quality in the Developing World
Agronomy 342 Presentation

Water Quality in the Developing World
E N D
Presentation Transcript
Water Quality in the Developing World By: Collin Klingbeil
Water, Water, Everywhere… • 70-75% of the Earth’s surface • 70% of the human body • Recommended 8 cups per day • 0.3% of the worlds water is useable by humans • Useable: Rivers, lakes, ground water • Unusable: Salt water, ice, water vapor
Causes of Poor Water Quality • Human Waste • In Southern Asia, 63% of rural people practice open defecation, 18% worldwide • Animal and fish wastes • Industrial/Agricultural wastes • 2 million tons of sewage and industrial and agricultural wastes are discharged into water every day • Many others
Human Health Effects of Poor Water Quality • Infectious diseases • Diarrheal (rotavirus, astrovirus, etc.) • 4 billion cases each year from unsafe water • Cholera • Trachoma • Death • 3.1% of all deaths are water related worldwide • About 400 children below age 5 die every hour from diarrheal diseases in developing countries
Environmental Effects of poor water quality • Animal/fish kills • Freshwater species are 5 times more likely to go extinct than land dwelling species • Reduced species diversity • Inland, 24% of mammals and 12% of birds are threatened
Economic Effects of Improved WQ for developing countries • Better health = better productivity • Yearly Economic growth rate: • Developing country with clean water = 3.7% • Developing country without clean water = 0.1% • For every $1 invested, a $3-$34 economic development return is projected • Freshwater species provide $75 billion in goods for people, but are threatened
Ethical Implications • Categorical Imperative and Justice: If some people have access to clean water, all people should • Utilitarianism: Do the most good for the most people. • Rights: People have a right to survive, they need water to survive, so they have a right to water.
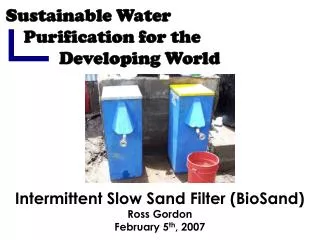
What can be done? • Installation of simple household latrines • Public education in developing countries • Sanitary water and hygiene practices • Reduce pollution to freshwater • Filtration (remove solids) • Disinfection (Chlorination, UV, boiling)
References • Background: http://patriciaquintessence.blogspot.com/2011/06/oceans-day-today.html • Gadgil A. Drinking Water in Developing Countries. Annu. Rev. Energy. Environ. 1998. 23:253-286. Accessed March, 6th 2012. Available at: http://www.annualreviews.org/doi/pdf/10.1146/annurev.energy.23.1.253 • Gundry S, Wright J, Conroy R. A systematic review of the health outcomes related to household water quality in developing countries. Journal of Water and Health. 2004. 02.1: 1-13. Accessed March, 6th 2012. Available at: http://www.iwaponline.com/jwh/002/0001/0020001.pdf • Montgomery M, Elimelech M. Water and Sanitation in Developing Countries: Including Health in the Equation. Environmental Science and Technology. January 1, 2007: pp 17-24. Accessed March, 6th 2012. Available at: http://pubs.acs.org/doi/pdf/10.1021/es072435t • World Water Quality Facts and Statistics. 2010. Accessed March, 6th 2012. Available at: http://www.pacinst.org/reports/water_quality/water_quality_facts_and_stats.pdf • 20 Interesting and Useful Water Facts. 2004. Accessed March, 6th 2012. Available at: http://www.allaboutwater.org/water-facts.html