Download

1 / 79
790 likes | 1.01k Vues
Power Sector Planning and Development: Lessons from Thailand’s and international experience. Chuenchom Sangarasri Greacen 9 March 2013 WORKSHOP ON “ELECTRIC POWER DEVELOPMENT & CHALLENGES IN MYANMAR: SHARING EXPERIENCES OF THE MEKONG REGION” Tonga Puri Hotel, Nay Pyi Taw, Myanmar.

E N D
Power Sector Planning and Development:Lessons from Thailand’s and international experience ChuenchomSangarasriGreacen 9 March 2013 WORKSHOP ON “ELECTRIC POWER DEVELOPMENT & CHALLENGES IN MYANMAR: SHARING EXPERIENCES OF THE MEKONG REGION” Tonga Puri Hotel, Nay Pyi Taw, Myanmar
The engine of sustainable economic & social development Environment People (peace, democracy, justice) Electricity • Improved • living standards & • economic opportunity: • Wealth generation • Access to electricity • Education • Health
Power sector planning in a nutshell Mechanism: • Assess needs, • Source supply • To meet objectives (e.g. reliability, job creation) • At reasonable price Approaches to planning: • Centralized (top-down) • Decentralized (bottom-up) Approaches to electrification • Off-grid/mini-grid • Grid extension
Centralized & decentralized generation HV Transmission HV substation MV distribution Cogeneration Biomass Plant/ Large solar farm Distribution transformer LV distribution Gasifier/ Solar farm/ Biogas Plant
Power sector planning in a nutshell Mechanism: • Assess needs, • Source supply • To meet objectives (e.g. reliability, job creation) • At reasonable price Approaches to planning: • Centralized (top-down) • Decentralized (bottom-up) Approaches to electrification • Off-grid/mini-grid • Grid extension What is the best approach for a country? • There may not be a “one-size-fit-all” solution • Diverse context and situation require diverse approaches
Parallel approach: extending the grid and encouraging rural mini-grids Top-down Bottom-up Customers Customers Mini-Grid National Grid Small Power Producer Large Plants
Thailand’s approach • Rural electrification = grid expansion + mini-grid • Community-scale power generation systems (e.g. microhydro) were forced to abandon their generation and mini-grids when grid electricity arrived • Centralized, monopoly (single buyer) model with strong emphasis on large-scale generation • Deterministic forecast, top-down planning process • Little participation in decision-making and sector development
Planning of capacity additions (Total capacity requirement = peak demand + 15% reserve margin)
Demand forecast • Demand treated as given • Deterministic model • Main assumptions: • GDP growth • Energy elasticity (electricity growth/GDP growth) • Population growth • Econometric model with some end-use data (e.g. floor space for offices or appliance ownership and efficiency for residential sector) if available
Source: Energy for Environment Foundation, Study Project for Load Forecast – Executive Summary.
The government used to assume a constant Energy Elasticity of 1.4 but the assumption did not hold. New Target 1 : 1 or lower Energy demand is 1.4 times higher than GDP growth Energy Elasticity = ∆tEnergy Consumption/ ∆tGDP Ave. Energy Elasticity 1.4 : 1.0 Thailand Source : EIA,DOE, BP Statistic Review of World Energy, EGAT
Choice of supply options considered in the PDP by EGAT 700 MW Coal-fired power plant 700 MW gas-fired combined cycle plant 230 MW gas-fired open cycle plant 1,000 MW nuclear plant Hydro imports are politically negotiated outside of PDP process DSM/EE, RE, Distributed generation not integrated in the optimization process
Outcome of Thai top-down, centralized, monopoly model • EGAT (also MEA & PEA) became “Poster-child” of World Bank, other foreign aid institutions • Access to soft loans, technical assistance, etc. • Rapid growth of sector and electrification rates • Rapid economic growth and industrial development
Many successes but there are also lessons learned… • Over-projection of GDP and demand forecasts leading to cycle of over-investments • Abandonment and discrimination of community-scale, decentralized energy systems • High dependency on imports • Impacts and conflicts • Inequality • Inefficiency • Uncompetitive and debt-ridden economy
Comparison of GDP: forecast vs. actual • GDP is the main assumption affecting the power demand forecast • Assumptions of GDP growth used in PDP2007 vs Actual.
Past demand forecasts compared to actual peak demand (MW) Used in PDP2010 Actual demand
Over-projections of demand leads to… • Over-expansion • Cycles of over-investments and burden on ratepayers • No incentive to promote energy efficiency and renewable energy • Unnecessary social, environmental impacts • Conflicts, violence and inequality
A World Bank funded project completed in 1994 Run-of-river 126 MW hydroelectric dam on a main tributary of Mekong River Source of on-going conflicts due to impacts on fish migration and livelihood of people Pak Mun Dam Story Photo: http://en.wikipedia.org/wiki/Pak_Mun_dam
Siam Paragon 123 1700 families relocated MBK 81 Loss of livelihood for >6200 families Central World Loss of 116 fish species (44%) Mae Hong Song 75 65 Fishery yield down 80% Electricity production and consumption (GWh) Impacts of Pak Mun Dam alone Source: MEA, EGAT, Searin, Graphic: Green World Foundation Pak Mun Dam Dams Shopping Malls
Changing energy intensity over 20-yr period Data source: Energy Information Administration 2008
Office of the National Economic and Social Development Board O F F I C E O F T H E P R I M E M I N I S T E R Low Value Creation High Import Contents & Sheer size of export to GDP High Energy Intensity & Low Efficiency & Unsustainable structure Macroeconomic Analysis Low Quality Education Low Quality labour Enabling factors: MACROECONOMIC MANAGEMENT (Low margin/return) Low Quality for Raw-material, machinery and equipment Insufficient inR&D Investment No immunity/ High volatility Financial System Lack of Saving Lack of regulation on industrial product’s quality control Low Basic infrastructure and Logistic development Slow Technology Development
Thailand’s power sector: sustainable economic development? • Evident economic, material development… • …but not sustainable • Needs to rely on ever-increasing energy imports • Vulnerability to supply disruptions due to high level of centralization • Unproductive, inefficient consumption only made possible by borrowing from the past (plundering resources) and the future (debt to be repaid) • Government debt now >40% of GDP • Household debt at 20-23% of income, to rise to 40%
Thailand’s economic, power sector growth Sustainable or quality economic, social development ≠ Energy obesity from unhealthy consumption habits that are financed by debt
Is there a better way?Yes!(Full report available for download at www.palangthai.org)
Not all energy demand/GDP $$$ are equal: some industries have high energy, environmental costs but low value to economy BOI investment privileges should take into account energy, economic value considerations Iron smelter industry High energy intensity Low value added Low competitiveness Demand for electricity is not a given. We can choose wisely what kind of industries or economic activities are worth supporting (e.g. given investment privileges) based on their energy, environmental costs and value to economy (local job creation, local content, value creation)
Government Policy Frameworkaccording to Energy Industry Act 2007 Need to make “energy security” and PDP accountable to government policy framework Framework for evaluating PDPs
Prioritize energy efficiency (least-cost supply options) T-5 Insulate roofs to keep cool in
Prioritize decentralized generation over centralized options:Cogeneration (Combined Heat and Power – CHP)
Cost of service (Baht/month) change in 2030 compared to 2010
Comparing PDPs against different elements of energy security change in 2030 compared to 2010(Negative value = improved elements of energy security)
Best practices from international experience • Case study of Pacific Northwest, USA (incl. Washington State) & Integrated Resource Planning (IRP) process
Objectives Defined IRP Flowchart ITERATION Data collection, systems analysis Demand forecast scenarios (by end use) Meeting electricity requirement: options T&D IMPROVEMENTS END-USE EFFICIENCY IMPROVEMENTS GENERATIONPLANTS UNIT COSTS OF ALTERNATIVES ($ / kWh) GWh YEAR B A C LEAST COST MIX $/kWh GWh Strategies Periodic Monitoring Source: D’Sa, A. (2005). "Integrated resource planning (IRP) and power sector reform in developing countries." Energy Policy 33(10): 1271-1285. Implementation
Resource Costs: fair, comprehensive cost comparison Source Northwest Power and Conservation Council, 6th Plan.
6th Plan Resource Portfolio* *Expected Value Build Out. Actual build out schedule depends on future conditions Source Northwest Power and Conservation Council, 6th Plan.
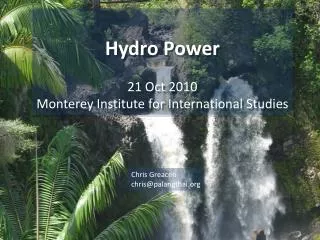
Economic Multiplier Effect The economic multiplier, also known as the multiplier effect, is a measure of how much economic activity can be generated in a community by different combinations of purchasing and investment. Xayaburi dam vs. RE or EE investment Source: US Department of Energy, The Jobs Connection: Energy Use and Local Economic Development, http://www.localenergy.org/pdfs/Document%20Library/The%20Jobs%20Connection.pdf Accessed March 8, 2013.
Lessons for Myanmar The engine of sustainable economic & social development Environment People (peace, democracy, justice) Electricity • Improved • living standards & • economic opportunity: • Wealth generation • Access to electricity • Education • Health
Parallel approach: extending the grid and encouraging rural mini-grids Top-down Bottom-up Customers Customers Mini-Grid National Grid Small Power Producer Large Plants
Special considerations for Myanmar • “The last frontier” • How to leverage external resources while maximizing benefits to the locals and without losing sovereign power • How to generate income while having sufficient resources to sustainably meet growing domestic needs
Strategy for Myanmar’s power sector planning, policy and development • Integrated economic and energy policy and planning • Minimize waste, maximize efficiency • Choose economic activities wisely: low energy & resource intensity, high economic value, high competitiveness • Maximize economic value for each energy investment: “getting the most bang (jobs, investments, purchasing) for the $$$ invested” • Prioritize utilization of distributed renewable over non-renewable resources • Empower participation by citizens, entrepreneurs and communities in power sector planning and development
Thank youQuestions and discussion Email: chom at palangthaidot org www.palangthai.org
Parallel approach: extending the grid and encouraging rural mini-grids Customers Customers Mini-Grid National Grid Small Power Producer Large Plants
Donor funds $ Power export $ Electrification Fund Regulatory framework allows for fair treatment of both