
Thermoelectric Power (TEP)
E N D
Presentation Transcript
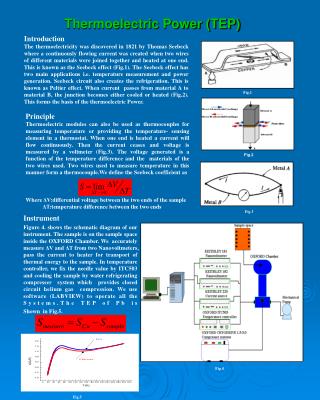
Introduction The thermoelectricitywas discovered in 1821 by Thomas Seebeck where a continuously flowing current was created when two wires of different materials were joined together and heated at one end. This is known as the Seebeck effect (Fig.1). The Seebeck effect has two main applications i.e. temperature measurement and power generation. Seebeck circuit also creates the refrigeration. This is known as Peltier effect. When current passes from material A to material B, the junction becomes either cooled or heated (Fig.2). This forms the basis of the thermoelectric Power. Fig.1 Thermoelectric Power (TEP) Principle Thermoelectric modules can also be used as thermocouples for measuring temperature or providing the temperature- sensing element in a thermostat. When one end is heated a current will flow continuously. Then the current ceases and voltage is measured by a voltmeter (Fig.3). The voltage generated is a function of the temperature difference and the materials of the two wires used. Two wires used to measure temperature in this manner form a thermocouple.We define the Seebeck coefficientas Where ΔV:differential voltage between the two ends of the sample ΔT:temperature difference between the two ends Fig.2 Fig.3 Instrument Figure 4. shows the schematic diagram of our instrument. The sample is on the sample space inside the OXFORD Chamber. We accurately measure ΔV and ΔT from two Nanovoltmeters, pass the current to heater for transport of thermal energy to the sample. In temperature controller, we fix the needle value by ITC503 and cooling the sample by water refrigerating compresser system which provides closed circuit helium gas compression. We use software (LABVIEW) to operate all the Systems.The TEP of Pb is Shown in Fig.5. Fig.4 Fig.5